Figure 7.
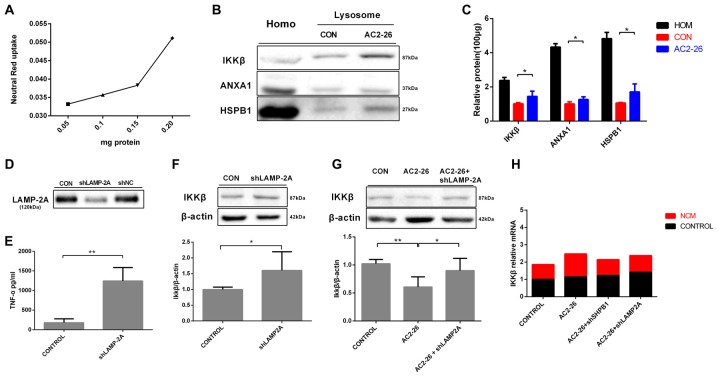
IKKβ is degraded by CMA. (A) Linearity of dye uptake with increasing amounts of lysosomal protein. (B) Homogenates (Homo) and lysosomes isolated from rat brain tissues were pretreated with chloroquine (50 μM) for 30 min at 4°C prior to the addition of Ac2-26(1 mg/g) for an additional 30 min. A total of 100 μg of protein was then processed and analyzed by Western blotting as indicated. (C) The protein levels of IKKβ, ANXA1, and HSPB1 per 100 μg of total protein from rat brain tissues. (D) Microglia were transfected with adenovirus carrying shRNA against LAMP-2A. LAMP-2A levels were examined by Western blotting. (E,F) Microglial cells were transfected with LAMP-2A shRNA. The supernatants were assessed for TNF-α by ELISA (E), and the cell lysates were analyzed with antibodies to IKKβ and β-actin by Western blotting (F). Microglial cells transfected with shLAMP-2A were then treated with Ac2-26, and protein levels were measured by Western blotting (G) as indicated. The data are representative of 3–6 independent experiments and were analyzed by one-way ANOVA with Tukey’s multiple comparison tests between three groups and unpaired Student’s t test between two groups. Throughout the figure, the error bars represent the mean ± SEM. *P < 0.05; **P < 0.01 vs. control. (H) Microglia transfected with shHSPB1 or shLAMP-2A for 48 h in the presence or absence of NCM for 24 h. The expression levels of IKKβ mRNA were determined by real-time quantitative PCR and normalized to β-actin. The levels of untreated control cells (CON) were set to100%. Data were analyzed by one-way ANOVA with Tukey’s multiple comparison tests.

