Figure 1.
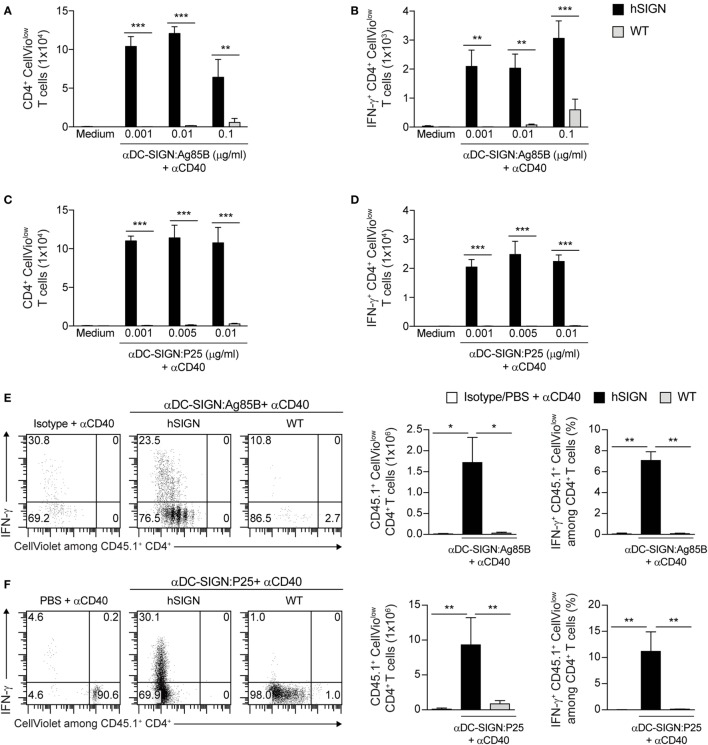
In vitro and in vivo targeting of Mycobacterium tuberculosis antigens to DC via DC-specific-ICAM3-grabbing-nonintegrin (DC-SIGN) induces strong CD4+ T-cell responses. (A–D) CellViolet-labeled CD4+ P25ktk T cells were co-cultured with WT or hSIGN BMDC targeted with increasing doses of (A,B) αDC-SIGN:Ag85B or (C,D) αDC-SIGN:P25 in the presence of αCD40 (1 µg/mL). After 4 days of co-culture (A,C) in vitro proliferation of CD4+ T cells and (B,D) intracellular IFN-γ production were determined by flow cytometry after restimulation with PMA/ionomycin. Bar graphs represent the (A,C) number of proliferating CellViolow CD4+ cells and (B,D) number of proliferating IFN-γ+ CellViolow CD4+ cells. Error bars represent SD of triplicate wells from one of three experiments. **p < 0.01 and ***p < 0.001; two-way ANOVA with Bonferroni’s post hoc test. (E,F) CellViolet-labeled CD45.1+ CD4+ P25ktk T cells were adoptively transferred into WT or hSIGN mice. One day later, mice were immunized with (E) αDC-SIGN:Ag85B (2 µg), (F) αDC-SIGN:P25 (2 µg) or an isotype control (2 µg) (E) or vehicle (F) in the presence of αCD40 (10 µg). Four days post-immunization (E,F) in vivo cell proliferation and intracellular IFN-γ production were determined by flow cytometry in splenocytes after ex vivo restimulation with PMA/ionomycin. Shown are representative flow cytometry plots depicting the percentage of IFN-γ+ CellViolow among CD45.1+ CD4+ T cells. Bar graphs represent the total number of proliferating CD45.1+ CellViolow CD4+ cells and percent of proliferating IFN-γ+ CD45.1+ CellViolow among all live CD4+ T cells. Error bars represent SD of 3–5 mice per group from one of two experiments. *p < 0.05, **p < 0.01, and ***p < 0.001; one-way ANOVA with Bonferroni’s post hoc test.

