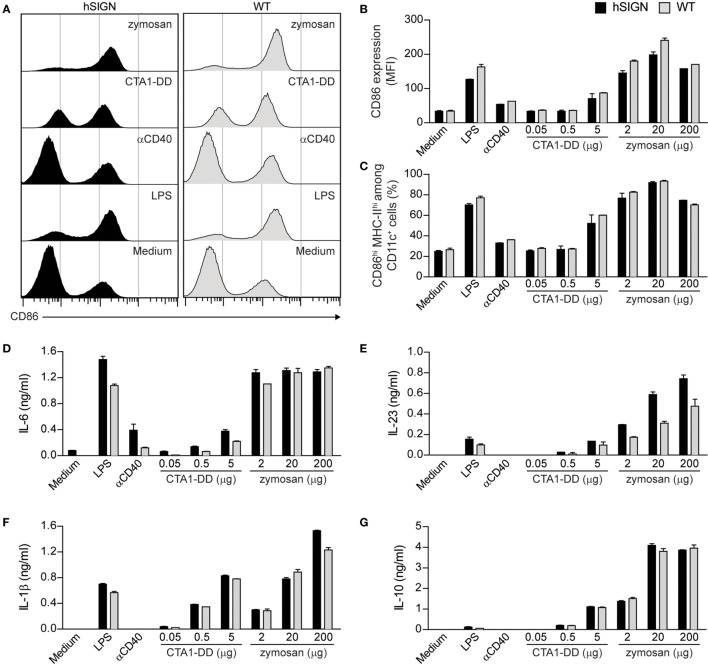
Figure 2.
CTA1-DD and zymosan induce DC activation and cytokine production. (A–G) WT or hSIGN BMDC were treated with αCD40 (1 µg/mL) and different concentrations of CTA1-DD and zymosan. LPS (100 ng/mL) was used as a positive control. After 24 h stimulation, (A–C) CD86 and MHC-II surface expression was determined by flow cytometry and (D) IL-6, (E) IL-23, (F) IL-1β and (G) IL-10 production by ELISA. (A) Representative histograms from one of three independent experiments. (B) Bar graphs represent mean fluorescence intensity (MFI) of CD86 and (C) percent of CD86hi MHC-IIhi among CD11c+ cells. Error bars represent SD of triplicate wells from one of three experiments.

