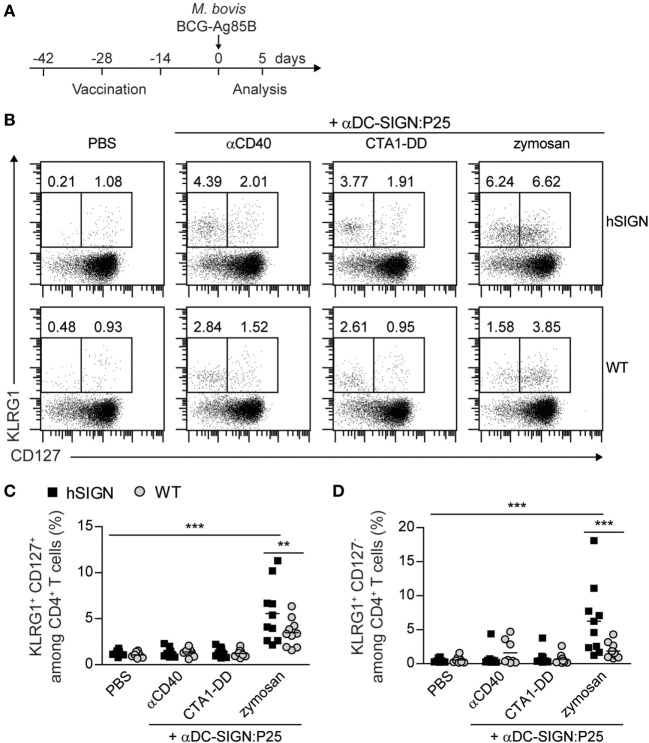
Figure 6.
αDC-SIGN:P25 plus zymosan generates hyperactivated CD4+ T cells. (A) Experimental scheme. WT or hSIGN mice were vaccinated i.p. at days −42, −28, and −14 with vehicle (PBS) or αDC-SIGN:P25 (10 µg) plus αCD40 (10 µg), CTA1-DD (10 µg) or zymosan (200 µg). At day 0, mice were challenged i.v. with 2 × 10⁶ Mycobacterium bovis BCG-Ag85B. Five days later, mice were sacrificed and blood was isolated and stained for killer cell lectin-like receptor G1 (KLRG1) and CD127 surface expression. (B) Representative flow cytometry plots depicting percentage of KLRG1+ CD127+ and KLRG1+ CD127− among CD4+ T cells. (C,D) Graphs represent percent of (C) KLRG1+ CD127+ and (D) KLRG1+ CD127− among CD4+ T cells of vaccinated mice. Each symbol represents an individual mouse and results are pooled from two experiments with 4–5 mice per group. **p < 0.01 and ***p < 0.001; two-way ANOVA with Bonferroni’s post hoc test.

