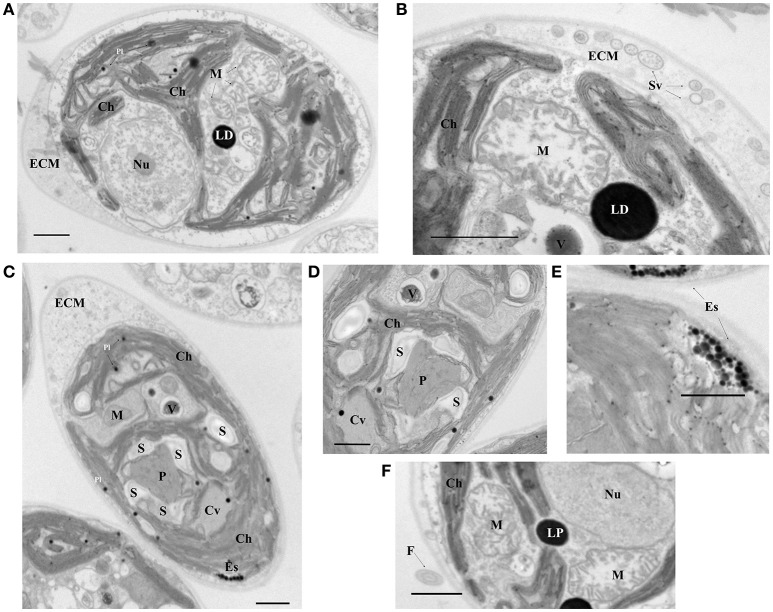
Figure 3.
Electron micrographs of the ChlSP strain. (A,C) Transverse sections of a single cell; (B,D–F) close up of cell components—(B) cell wall and detail of a mitochondria, (D) pyrenoid, (E) eyespot, and (F) flagellum. Scale bars, 1.0 μm. (Ch, chloroplast; M, mitochondrial profiles; Nu, nucleolus within the nucleus; Pl, plastoglobules; LP, lipid droplets; P, pyrenoid; S, starch F, flagellum; Es, Eye spot; ECM, extracellular matrix; Sv, secretory vesicles; Cv, contract vacuole profile; V, vacuole with possible U precipitates).

