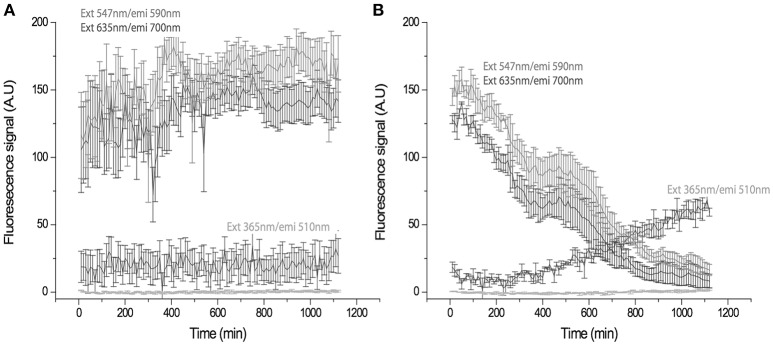
Figure 4.
Time-trace showing fluorescence signal in arbitrary units (A.U.) of the cells at different emission longitudes in the absence (A) and presence of U (B). (A) The control emission remains constant, cells emitted at 590 and 700 nm, after 20 h. (B) The U-exposed sample shows a gradual change in the emission of the cells from 590 nm and 700 nm to 510 nm. Changes are compatible with U uptake being appreciable at 10 h. Maximum intensity is reached at 20 h. (ext, excitation; emi, emission).

