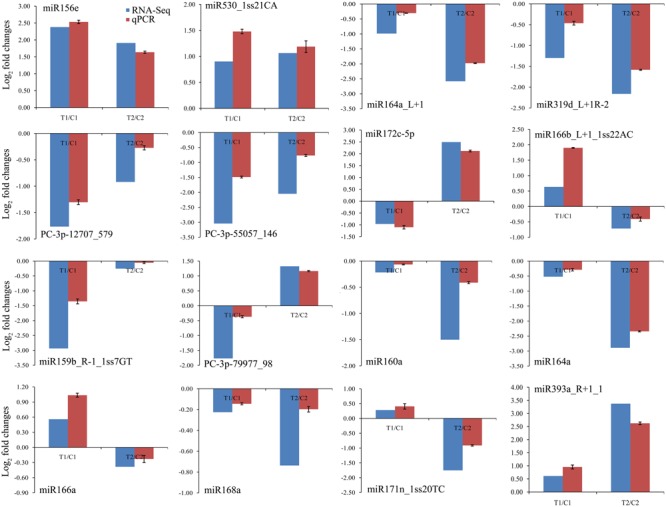
FIGURE 4.

Comparisons of the expression levels of 16 miRNAs in seeds of two peanut RILs. The expression levels were normalized to the expression of Actin in qPCR. Red indicates the fold-changes of miRNA expression levels determined by qPCR. Blue indicates the miRNA expression fold-changes generated from the deep sequencing. The experiments were repeated three times, and vertical bars indicate the standard errors.
