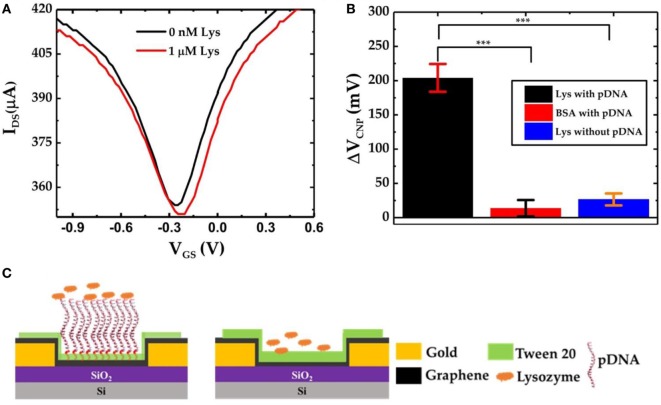
Figure 5.
(A) IDS–VGS characteristics of graphene-PBASE field-effect transistor (FET) [without probe DNA (pDNA)] device before and after exposure to 1 µM lysozyme; (B) comparative bar chart showing the ΔVCNP of the graphene-PBASE FET devices with the pDNA functionalization after exposure to 1 µM lysozyme and 1 µM bovine serum albumin and without pDNA functionalization (n = 3, error bar = 1 SD, paired Student’s t-test, ***p < 0.001); and (C) the schematic diagram of the graphene field-effect transistor with pDNAs (left) and without pDNAs (right).

