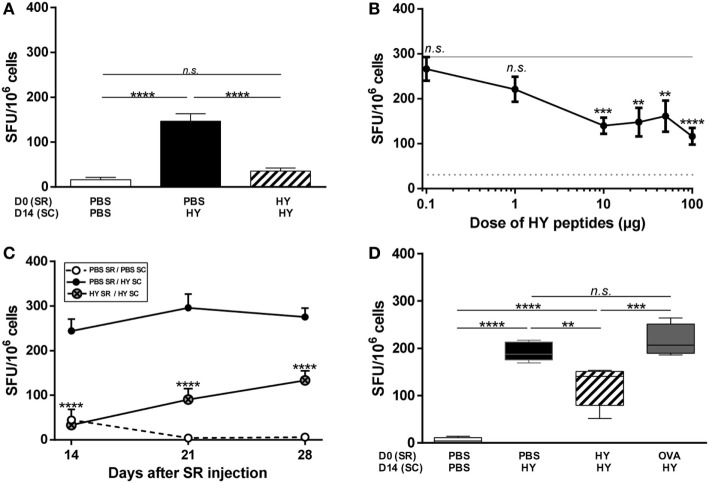
Figure 1.
Inhibition of the T-cell immune response after subretinal injection of HY peptides. (A) PBS or 50 µg of UTY + DBY (HY) peptides were injected in the subretinal space (SR) of mice on day 0. 2 weeks later, the immune response was challenged by subcutaneous immunization (SC) of either PBS:CFA or HY:CFA (The number N of experiments is 6). (A–D) The immune response of total splenocytes re-stimulated in vitro by HY peptides was assessed 1 week after immunization by IFNγ ELISpot (5 mice/group/experiment). (B) PBS or different doses of HY peptides (0–100 µg) were injected in the SR of mice on day 0. 2 weeks later, the immune response was challenged by a subcutaneous immunization of either PBS:CFA or HY:CFA, and the analysis was performed 1 week after the immunization (N = 3). (C) PBS or 50 µg of HY peptides was injected in the SR of mice on day 0. 1, 2, or 3 weeks later, the immune response was challenged by a subcutaneous immunization of either PBS:CFA (PBS SR/PBS SC group) or HY:CFA (PBS SR/HY SC group; HY SR/HY SC group) (N = 2). (D) PBS, HY peptides, or ovalbumin were injected in the SR of mice on day 0. 2 weeks later, the immune response was challenged by a subcutaneous immunization of either PBS:CFA or HY:CFA (Data representative from 1 of 2 experiments). All results are represented as mean ± SEM. Statistical analysis: ANOVA, Tukey post-test. (B,C) Statistics presented are the results of HY SR/HY SC group compared to PBS SR/HY SC group. SFU, spot forming units.

