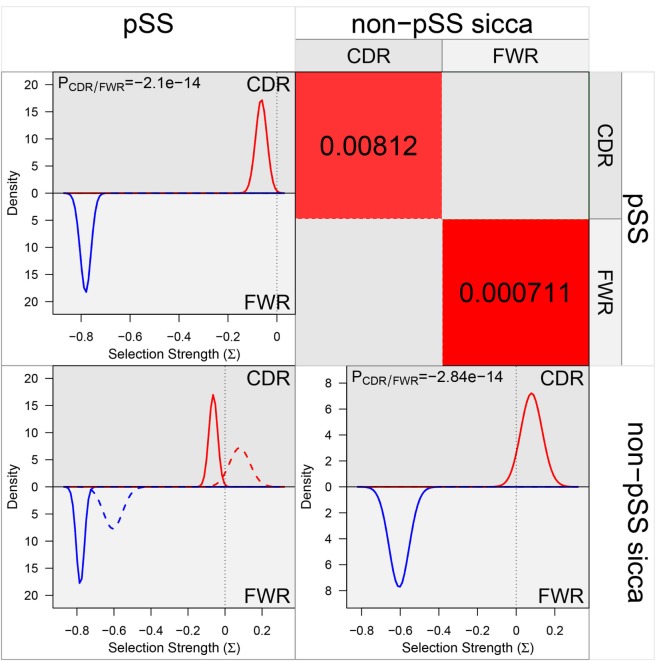
Figure 4.
The selection pressures on IGHV sequences derived from dominant clones in pSS patients and non-pSS controls. All individual sequences from the dominant clones from pSS and non-pSS control parotid gland biopsies were inserted into the BASELINe program and the selection strength of both groups were compared. The figure is obtained as output data from the BASELINe program. The red line in the upper left plot represents the selection strength of the pSS sequences in the complementarity determining regions (CDRs). The blue line represents the (negative) selection strength in the framework (FWR) regions. In the lower right plot, the red line represents the selection strength of the non-pSS control sequences in the CDRs and the blue line the strength in the FWRs. The lower left plot is an overlay plot in which the solid line is the selection strength for pSS and the dashed line for non-pSS. Significance of differences in selection pressures was calculated both for CDRs and FWR regions between pSS and non-pSS samples in the upper right plot.

