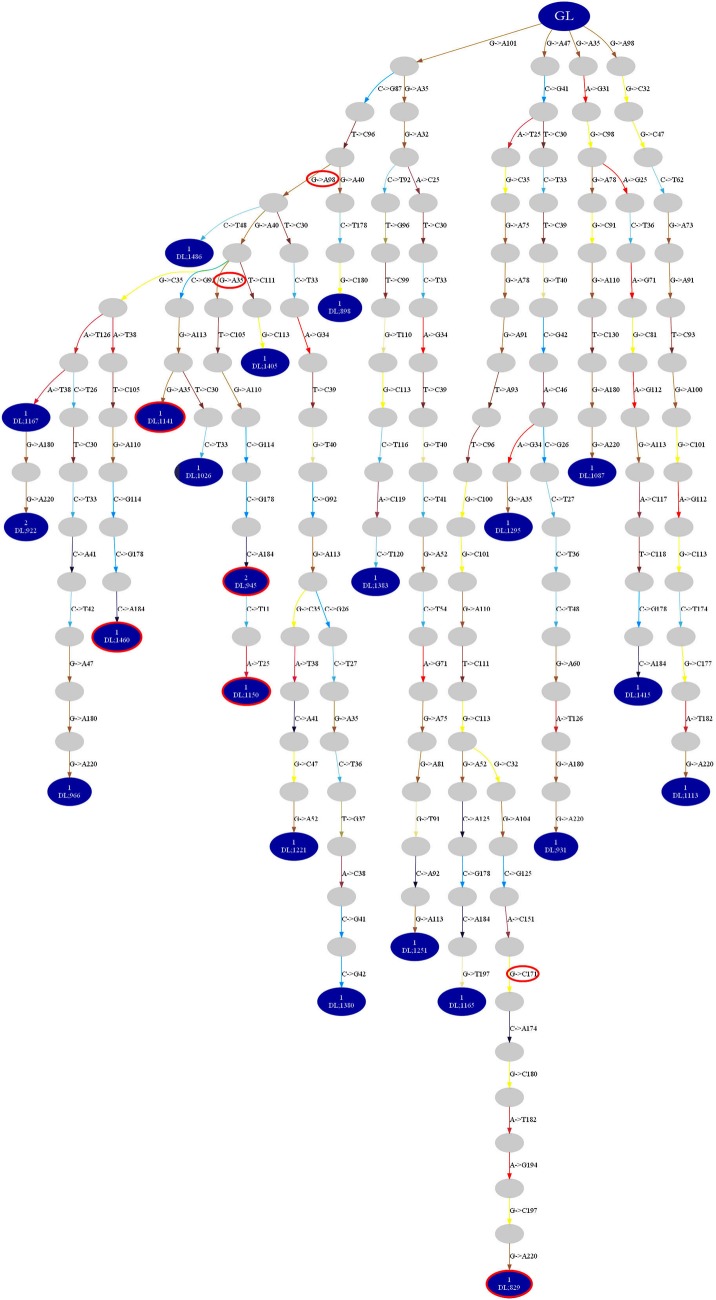
Figure 6.
Lineage tree constructed by IgTree© from IGHV sequences of a dominant clone-derived from a parotid gland of a pSS patient. The blue dots depict the IGHV sequences obtained from the parotid gland biopsies. The gray dots represent theoretical IGHV sequences generated by the algorithm of the IgTree© program. The red circled dots represent obtained IGHV sequences with ac-Nglycs. The red circles depict the mutation responsible for ac-Nglycs. GL: germline sequence.

