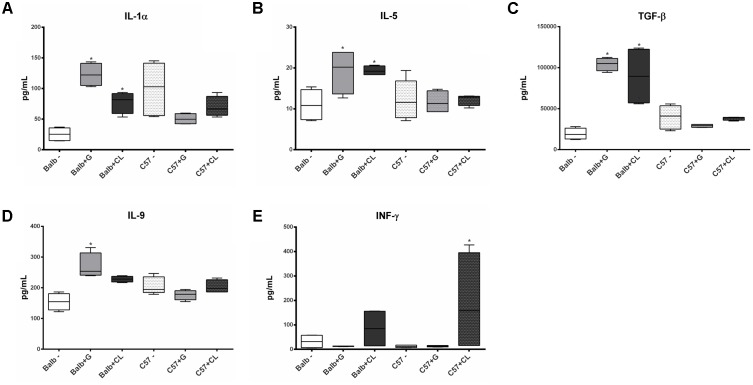
FIGURE 3.
Cytokines with altered serum levels in infected mice at 2 dpi. Serum samples were obtained from C57BL/6 and BALB/c mice uninfected or infected with G or CL strains at 2 dpi for the quantification of cytokines levels. Box plots correspond to the concentrations of IL-1α (A), IL-5 (B), TGF-β (C), IL-9 (D), and INF-γ (E), which were different in some groups from the control mice at this time point. ∗ indicates a significant difference (p < 0.05) between infected and uninfected mice [control (–)].

