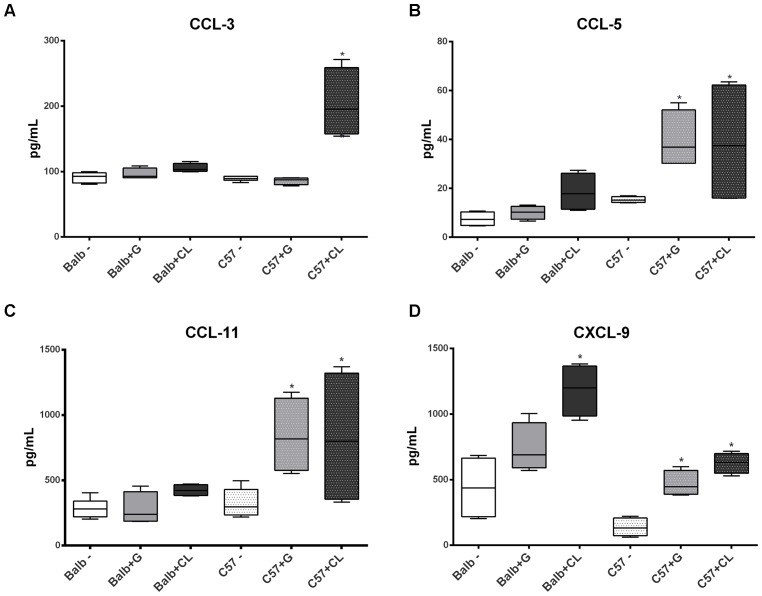
FIGURE 8.
Altered levels of serum chemokines at 90 dpi. Box plots represent the concentrations of CCL-3 (A), CCL-5 (B), CCL-11 (C), and CXCL-9 (D), which were quantified in the serum from C57BL/6 and BALB/c uninfected mice or those infected with G or CL strains, and the concentrations differed from those of the control at 90 dpi. ∗ indicates a significant difference (p < 0.05) between the infected and uninfected mice [control (–)].

