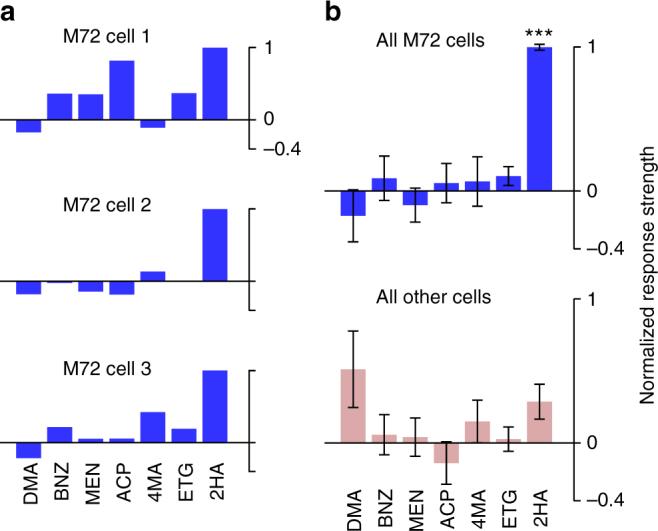
Fig. 7.

Odor-evoked rate responses display stereotypy also only for the strongest ligand. a Odor response profiles of three M72-MT cells, calculated as the mean change in spike count over the duration of the entire first sniff. Each cell’s responses are normalized such that 0 (horizontal line) is the spike count during baseline (air) and 1 is the maximum spike count across odors. b Odor response profiles averaged across the population; for M72-MT cells (top) and generic MT cells (bottom). M72-MT response is significantly higher than the generic MT response only for 2HA (Wilcoxon signed-rank test). Error bars = SEM
