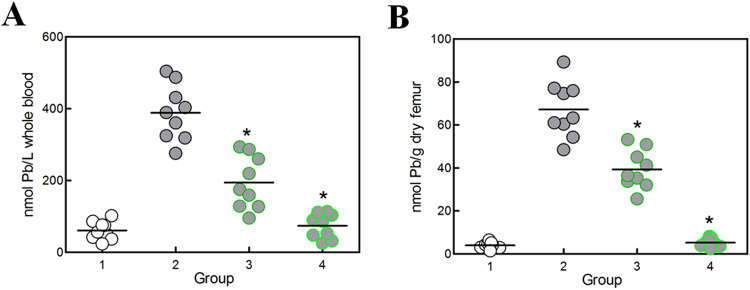
Figure 5.
Lead content in whole blood (A) and femur (B) in mice. Male KM mice were given no lead (group 1), lead acetate + Lpp-OmpA displayed E. coli (group 2), saturatedly leaded PbrR-displayed E. coli (group 3), and unsaturatedly leaded PbrR-displayed E. coli (group 4), in a dose of about 20 μg lead/mouse daily. Blood and femur were harvested on day 15, and lead concentrations were determined. Each circle represents one sample (n = 9), and the bars indicated the mean values. *A significant difference (One-way ANOVA statistical analysis, P < 0.001) when compared to group 2, while there is no significant difference between group 1 and group 4.

