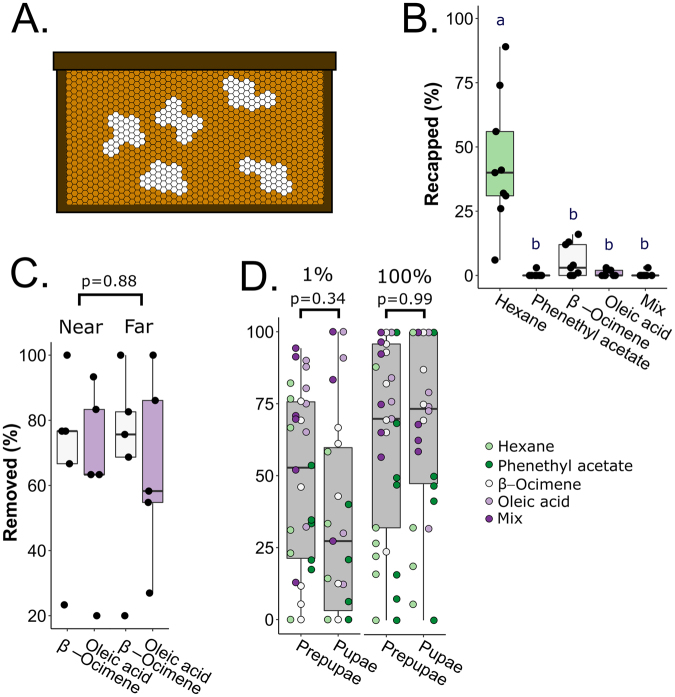
Figure 1.
Front-way odorant assay preliminary tests. (A) Schematic of the front-way assay. Patches of capped brood (~30 cells in technical duplicate per colony) developing naturally in a standard frame were uncapped (white patches) and 1 µl of odorants (β-ocimene, oleic acid, a 1:1 v/v mix of the two, phenethyl acetate or hexane) at either 1% or 100% concentrations (v/v in hexane) were dispensed onto the brood. Frames were incubated in the colony’s brood box for 3 hours before recording removal rates. (B) Post-front-way assay recapping frequencies. Data from N = 9 colonies were analyzed with a one-way ANOVA (level: odorant; F = 13.3, p = 2.4e-8) followed by a Tukey HSD test. Letters indicate groups that are significantly different from one another Tukey HSD p < 0.05). (C) Preliminary test for a patch proximity effect. N = 5 colonies were tested, varying the distance between β-ocimene and oleic acid patches (near = patches on the same frame, separated by one band of untreated capped brood; far = patches on different frames separated by two untreated brood frames). We analyzed the data by a two-way ANOVA and found no effect of patch (F = 0.025, p = 0.88) nor interactive effect between patch and odorant (F = 0, p = 1.0). (D) Preliminary test for a brood age effect. We performed the front-way assay on N = 9 colonies and calculated the percent prepupa and pupa removal. Due to variability in patch composition, not every colony had the same number of replicates for each stage and dose (see Table 1 for all sample sizes). Data were analyzed with a four-way ANOVA (levels: odorant, age, hygienicity, dose), which identified no significant effect of age nor interactions with any other factors, followed by a Tukey HSD test. 1% and 100% refer to odorant concentrations. All boxes depict the interquartile range (IQR) and the whiskers span 1.5*IQR.

