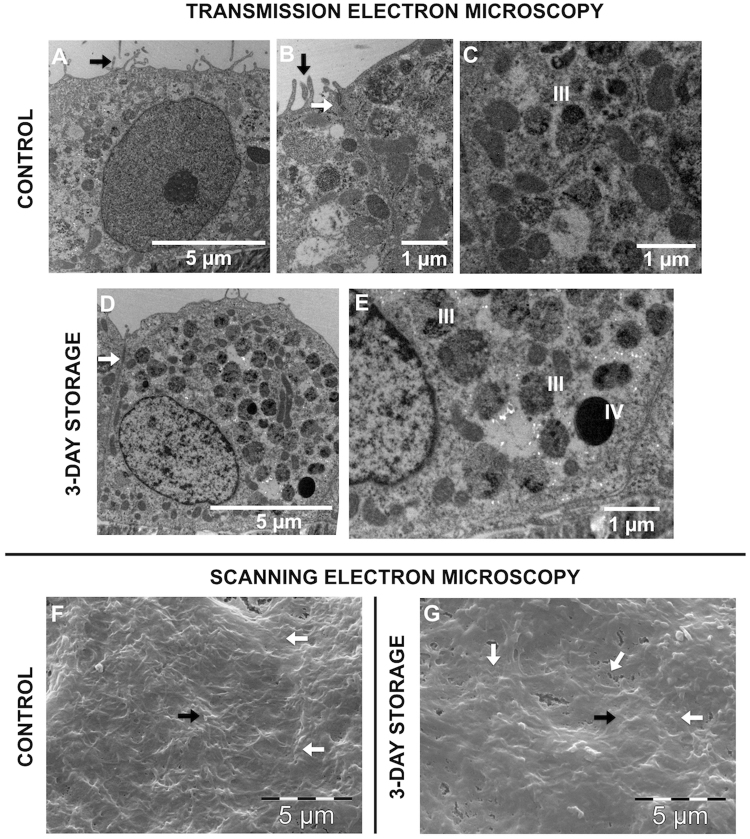
Figure 6.
Ultrastructure of stored hRPE cells compared to control. Transmission and scanning electron microscope photomicrographs of control cells that have not been stored (A–C,F) and hRPE cells that have been stored at 4 °C in the optimal additive combination for three days (D,E,G). Intercellular tight junctions are present both between control cells and between cells stored in the optimal additive combination (white arrows in B,D). Microvilli are present in both groups, demonstrated both by transmission and scanning electron microscopy (black arrows in A,B,F,G). Photomicrographs C and E demonstrate the presence of melanosomes at stage III (some melanin pigment deposited onto internal striations) in the control group and stage III and IV (fully melanized) in the storage group. Cell borders are indicated by white arrows (F,G).

