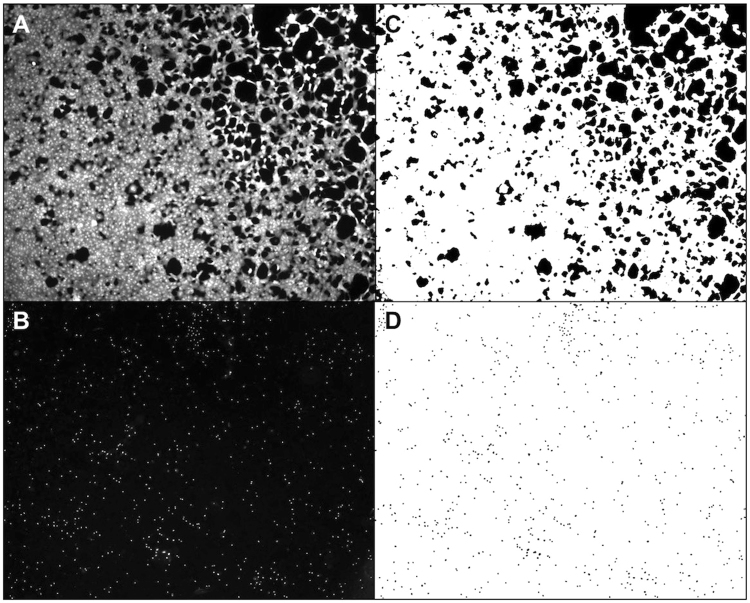
Figure 9.
Quantification of viable cells. Following storage, hRPE cells were stained with calcein-acetoxymethyl ester (CAM) (A) to visualize viable cells and ethidium homodimer-1 (EH-1) (B) to identify dead cells. Images of CAM-stained (C) or EH-1-stained (D) cells were segmented by ImageJ based on the fluorescence intensity. To compare the amount of live and dead cells between groups, ImageJ quantified the area (white) of the viable cells (C) and counted the number of particles that represented dead cell nuclei (D).

