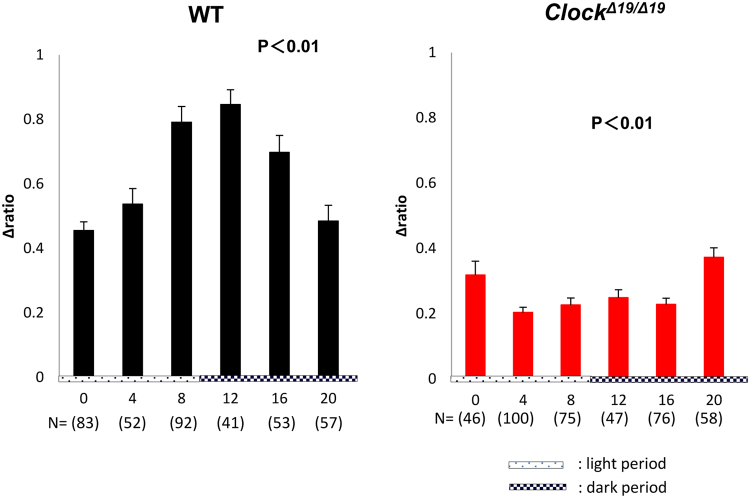
Figure 3.
Time-dependent changes in the average peak of intracellular Ca2+ influx ([Ca2+]i) after stretch stimulation. The time-dependent changes in the average peak of [Ca2+]i at post-stretch: Wild-type (WT) mice (black) and ClockΔ19/Δ19 mice (red). The number of analyzed cells is 83, 52, 92, 41, 53, and 57 in the WT mice, and N = 46, 100, 75, 47, 76, and 58 in ClockΔ19/Δ19 mice from 0 to 20 h. Data are presented as the means ± standard error (SE). The numbers of analyzed cells are indicated in parenthesis below the chart. The abscissa of the each graph is the time axis. 0 h means 12 hours after horse serum shock (HSS). Statistical analyses were done using a one-way analysis of variance (ANOVA) to compare differences among the time points in each group.

