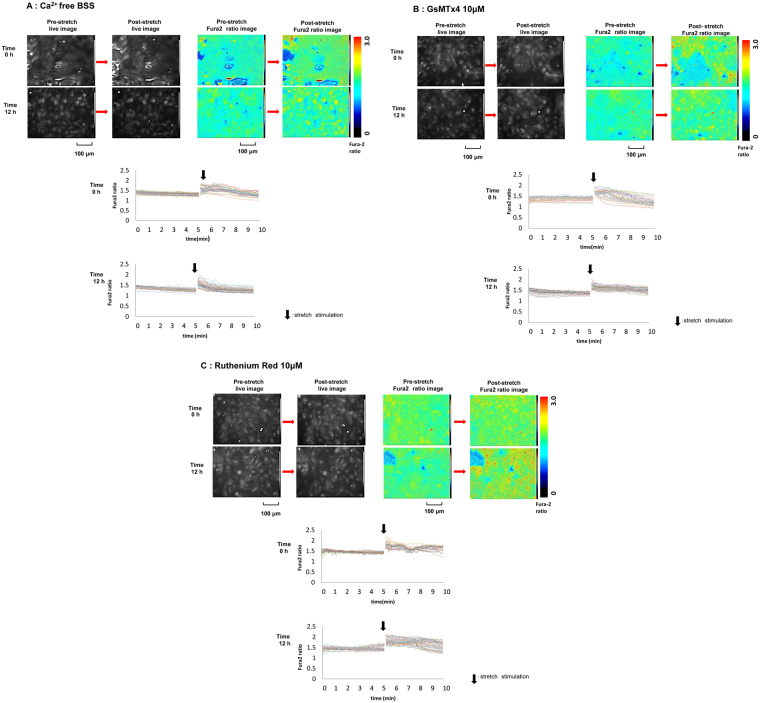
Figure 4.
Images of Fura2 ratio at pre- and post-stretch under different conditions. The representative live images (upper left panels) and Fura2 ratio images (upper right panels) of primary cultured urothelial cells at pre- and post-stretch at difference time point, 0 and 12 h, and the traces of Fura2 ratio changes in all of analyzed cells (lower panels). (A) Ca2+ free balanced salt solution (BSS). (B) GsMTx4 10 μM treated conditions. (C) Ruthenium Red 10 μM treated conditions. Time 0 means 12 hours after horse serum shock (HSS). Black arrows denote the onset of the stretch. The stretch speed was fixed at 100 μm/s, and the distance was 100 μm. Cells were extended transversely in both cell types. Scale bar: 100 μm.

