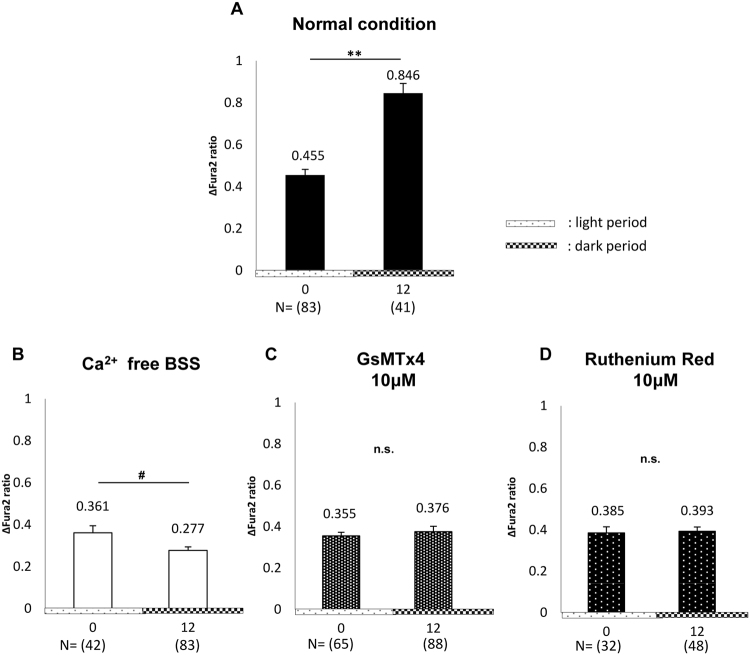
Figure 5.
Effect of extracellular Ca2+, GsMTx4, and Ruthenium Red (RR) on intracellular Ca2+ influx ([Ca2+]i) after stretch stimulation. The changes of average peak of [Ca2+]i at post-stretch between 0 h and 12 h in wild-type (WT) mice. (A) Normal conditions. (B) In the absence of extracellular Ca2+ (Ca2+ free balanced salt solution (BSS)). (C) In the presence of 10 μM GsMTx4 (GsMTx4 10 μM). (D) In the presence of 10 μM RR (Ruthenium Red 10 μM). At 0 h, (N) vs. (a), (N) vs. (b), and (N) vs. (c); P < 0.05, P < 0.01, and P = 0.14 by the Mann–Whitney U-test, respectively. At 12 h, (N) vs. (a), (N) vs. (b), and (N) vs. (c); P < 0.01, P < 0.01, and P < 0.01, by the Mann–Whitney U-test, respectively. The numbers of analyzed cells are indicated in parenthesis below of the chart. The numbers above error-bar indicate the average of the measured values. Time 0 means 12 hours after horse serum shock (HSS). Statistical analyses were performed using Student’s t-test in A and D, Welch’s t-test in B, and the Mann–Whitney u-test in C. Data are presented as the means ± standard error (SE). * or #P < 0.05, **P < 0.01, n.s., not significant.

