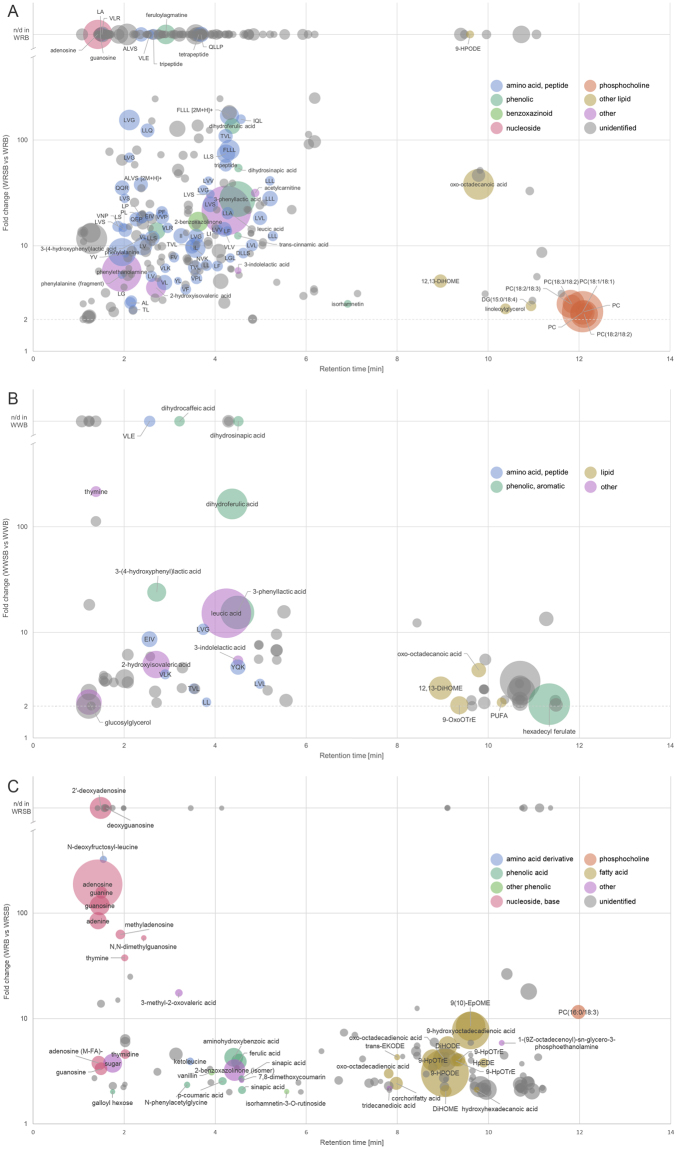
Figure 4.
ubble plots of the statistically significant (p < 0.01) compounds with increased levels (FC ≥ 2) in sourdough whole-grain rye breads compared with corresponding yeast fermented whole-grain breads. The area of each sphere represents the average signal intensity of the molecular ion in the sourdough fermented bread and the color represents the compound group. Unidentified compounds are grey in color. The y-axis (fold change) has been transformed into base-10 logarithmic scale, which has been truncated to show the compounds with an infinite fold change (compounds not detected in yeast fermented bread). (A) Increased compounds in sourdough whole-grain rye bread detected with the reversed-phase (RP) column in the positive and negative mode. (B) Increased compounds in sourdough whole-grain wheat bread detected with the RP column in the positive and negative mode. (C) Compounds with significantly decreased levels in sourdough whole-grain rye bread detected with the RP column in the positive and negative mode.

