Fig. 1.
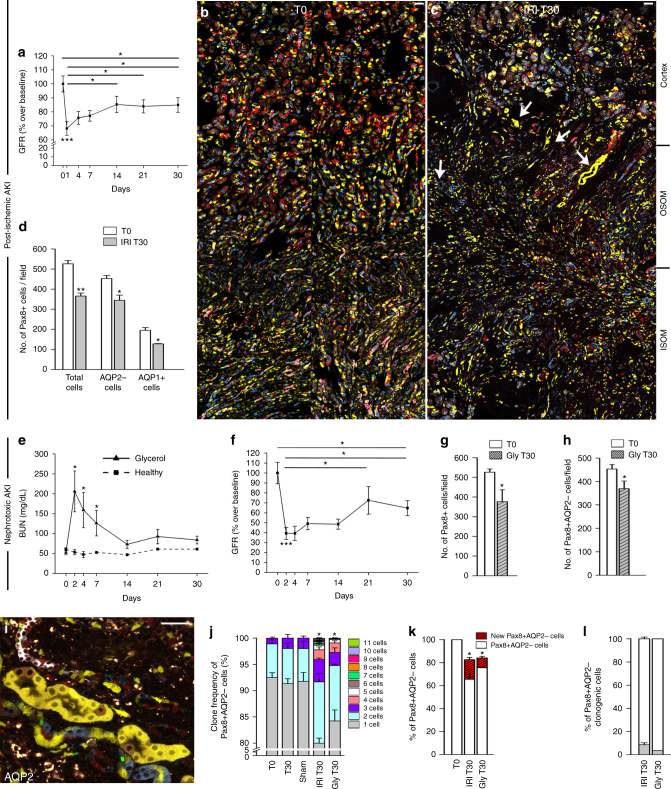
Only a small TEC subset proliferates after AKI and partially replaces lost TECs. a GFR in ischemic mice (n = 13) normalized on the GFR at baseline and on sham-operated control group (n = 5). One-way ANOVA post hoc Tukey. b, c Juxtaposed images of a Pax8/Confetti mouse kidney at day 0 (T0, n = 5) (b) and 30 after IRI (IRI T30, n = 4) (c). Arrows indicate single-colored clones. OSOM outer stripe of outer medulla; ISOM inner stripe of outer medulla. d Number of Pax8+, Pax8+AQP2−, and Pax8+AQP1+ cells in Pax8/Confetti mice at day 0 (T0, white column, n = 5) and at day 30 after IRI (IRI T30, gray column, n = 4). Mann–Whitney test. *p < 0.05, **p < 0.01 IRI T30 vs. T0. e BUN in healthy Pax8/Confetti mice (n = 5) and in Pax8/Confetti mice after nephrotoxic AKI (n = 6). One-way ANOVA post hoc Tukey *p < 0.05 glycerol-treated mice vs. healthy. f GFR in Pax8/Confetti mice after nephrotoxic AKI (n = 7) normalized on the GFR at baseline and on healthy mice (n = 5). One-way ANOVA post hoc Tukey. g Number of Pax8+ cells in Pax8/Confetti mice at day 0 (T0, white column, n = 5) and day 30 after nephrotoxic AKI (Gly T30, gray with sparse pattern column, n = 4). Mann–Whitney test *p < 0.05 Gly T30 vs. T0. h Number of Pax8+AQP2− cells in Pax8/Confetti mice at day 0 (T0, white column, n = 5) and day 30 after nephrotoxic AKI (Gly T30, gray with sparse pattern column, n = 4). Mann–Whitney test *p < 0.05 Gly T30 vs. T0. i Single-colored clones in AQP2− tubules in Pax8/Confetti mice at day 30 after IRI (n = 4). AQP2 staining is white. j Clone frequency analysis of Pax8+AQP2− cells in Pax8/Confetti mice at day 0 (T0, n = 5), in age-matched controls (T30, n = 4), in sham-operated mice (n = 4), at day 30 after IRI (IRI T30, n = 4) and at day 30 after nephrotoxic AKI (Gly T30, n = 4). Mann–Whitney test *p < 0.05 IRI T30 vs. T0, T30, sham and Gly T30 vs. T0 and T30. k Percentage of Pax8+AQP2− cells in Pax8/Confetti mice at day 0 (T0, n = 5), at day 30 after IRI (IRI T30, n = 4) and at day 30 after nephrotoxic AKI (Gly T30, n = 4). Mann–Whitney test *p < 0.05 IRI T30 and Gly T30 vs. T0. l Percentage of Pax8+AQP2− clonogenic cells (gray column) in Pax8/Confetti mice at day 30 after IRI (IRI T30, n = 4) and at day 30 after nephrotoxic AKI (Gly T30, n = 4) vs. day 0 (n = n = 5). The white column is the percentage of Pax8+AQP2− that did not generate clones. Data are mean ± SEM. Scale bars 40 µm. Pax8+ = Pax8 lineage-positive cells

