Fig. 6.
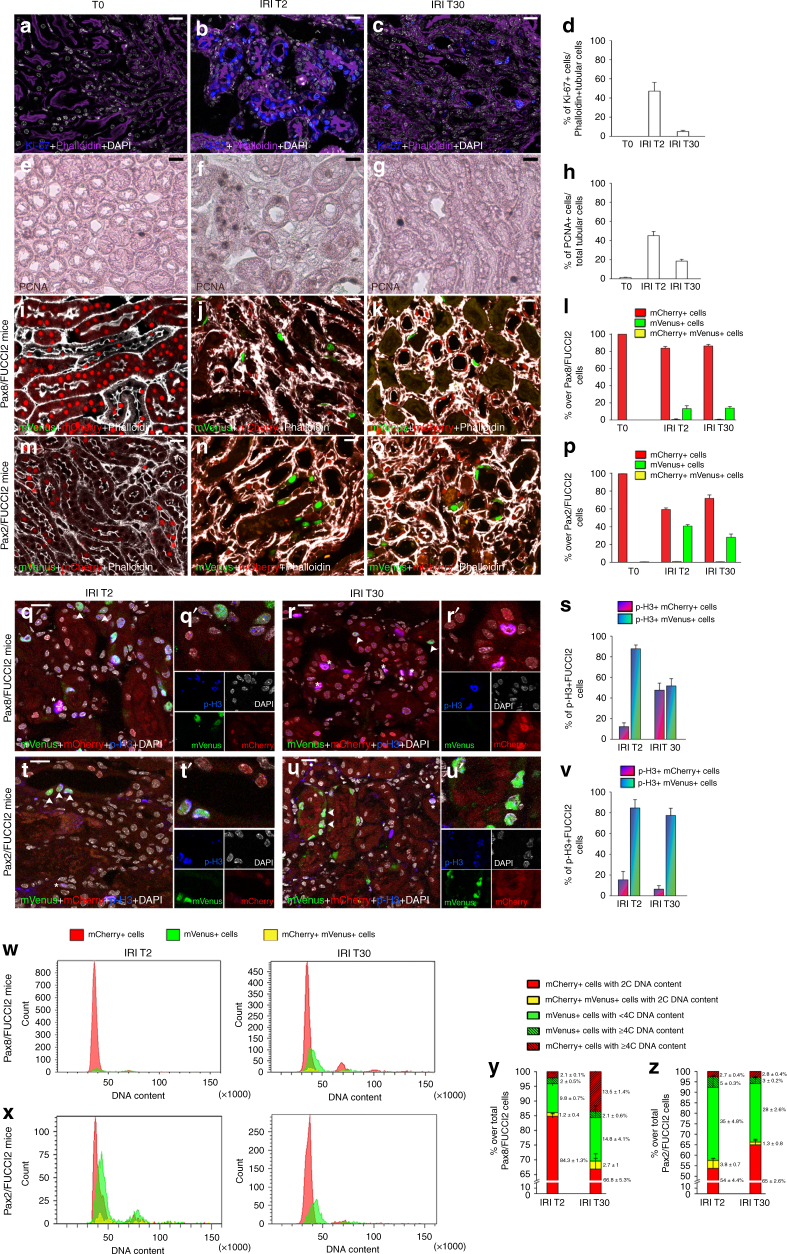
Cell cycle markers misrepresent proliferation after AKI because numerous TEC endocycle. a–c Ki-67+ (blue) Phalloidin+ (purple) tubules at day 0 (a), 2 (b) and 30 after IRI (c) (n = 3 per group). d Percentage of Ki-67+ cells over Phalloidin+ TECs at T0, IRI T2, and IRI T30 (n = 3 per group). e–g PCNA+ cells at T0 (e), IRI T2 (f), and IRI T30 (g) (n = 5 per group). h Percentage of PCNA+ cells over TECs at T0, IRI T2, and IRI T30 (n = 5 per group). i–k mCherry+ cells (red) and mVenus+ cells (green) in Pax8/FUCCI2 mice at T0 (i), IRI T2 (j), and IRI T30 (k) (n = 4 per group). Phalloidin staining is white. l Percentage of mCherry+ cells, mVenus+ cells and mCherry+mVenus+ cells in Pax8/FUCCI2 mice at T0, IRI T2, and IRI T30. (n = 4 per group). m–o mCherry+ cells (red) and mVenus+ cells (green) in Pax2/FUCCI2 mice at T0 (m), IRI T2 (n) and IRI T30 (o) (n = 4 per group). Phalloidin staining is white. p Percentage of mCherry+ cells, mVenus+ cells and mCherry+mVenus+ cells in Pax2/FUCCI2 mice at T0, IRI T2, and IRI T30. (n = 4 per group). q, r mCherry+ cells (red), mVenus+ cells (green) and p-H3+ cells (blue) in Pax8/FUCCI2 mice at IRI T2 (q) and IRI T30 (r) (n = 4 per group). q′, r′ Details indicated by arrowheads and asterisks in q and r. s Percentage of p-H3+mCherry+ cells and p-H3+mVenus+ cells in Pax8/FUCCI2 mice at IRI T2 and IRI T30. (n = 4 per group). t, u mCherry+ cells (red), mVenus+ cells (green) and p-H3+ cells (blue) in Pax2/FUCCI2 mice at IRI T2 (t) and IRI T30 (u) (n = 4 per group). t′, u′ Details indicated by arrowheads in t and u. v Percentage of p-H3+mCherry+ cells and p-H3+mVenus+ cells in Pax2/FUCCI2 mice at IRI T2 and IRI T30. (n = 4 per group). w, x Cell cycle distribution of mCherry+, mVenus+, and mCherry+mVenus+ cells in Pax8/FUCCI2 mice (w) and Pax2/FUCCI2 mice (x) at IRI T2 (n = 4, left) and at IRI T30 (n = 5, right). Representative experiments are shown. y, z Percentage of cells over total Pax8/FUCCI2 cells (y) and over total Pax2/FUCCI2 cells (z) at IRI T2 (n = 4) and IRI T30 (n = 5). Data are mean ± SEM. Scale bars 20 µm. DAPI (white) counterstains nuclei. T0 = day 0, IRI T2 = day 2 after IRI, IRI T30 = day 30 after IRI

