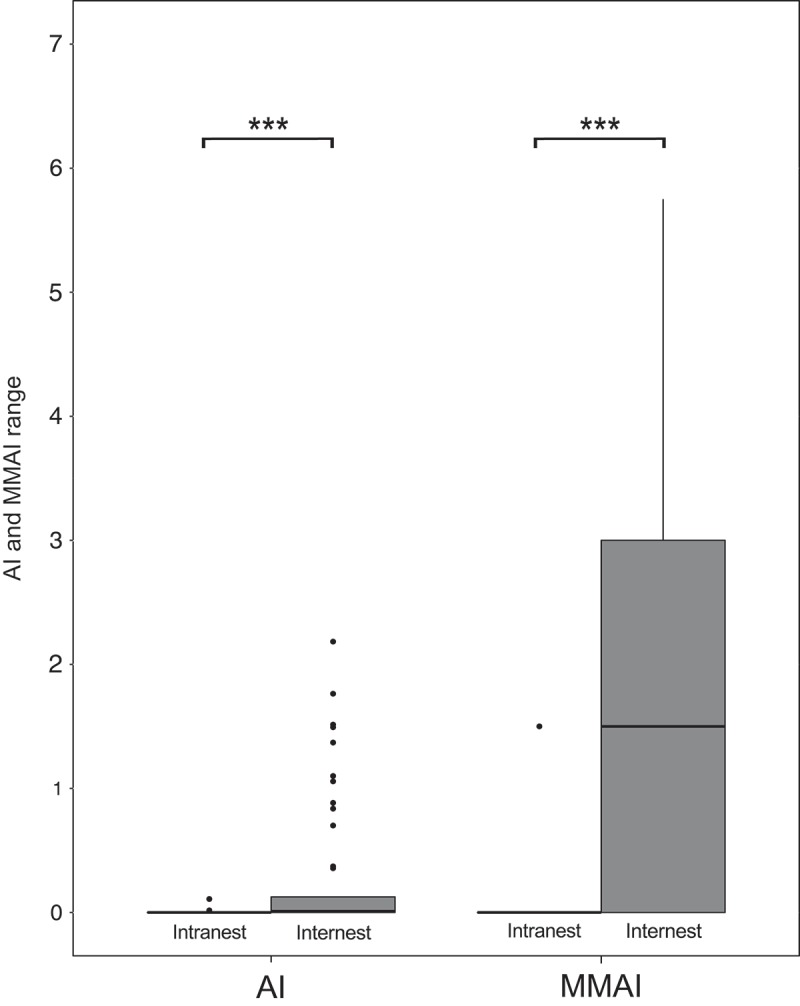
Fig. 3.

Aggression index (AI) values and mean maximum aggression index (MMAI) values from Tyrol on different organisational scales. Intranest and internest represent the aggression indices observed within and between nests, respectively. Whiskers represent the lowest and highest data still within 1.5 interquartile range of the lower and upper quartile, respectively, and dots represent outliers beyond the 1.5 interquartile range. Asterisks represent significant differences between intranest and internest behaviour levels (two-sided t-tests, *** = P < 0.001).
