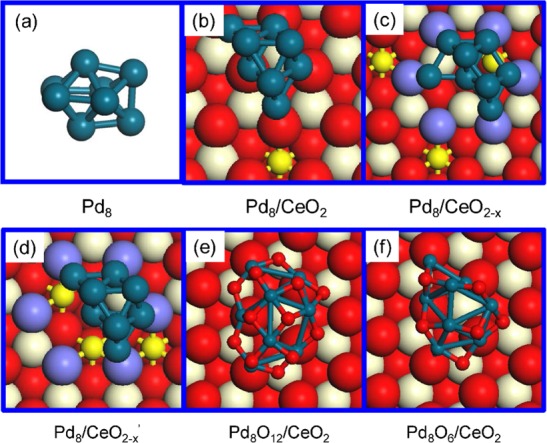
Figure 1.

Structures of Pd8 and CeO2 supported Pd8 and Pd8Ox nanoparticles. (a–c) Optimized structure of Pd8 as a free particle, and on the stoichiometric and defective ceria surfaces (optimized by GA-DFT). (d) Metastable structure of Pd8 on the defective ceria. (e,f) Structures of Pd8Ox/CeO2 (x = 12 and 6) obtained by GCMC-DFT at 300 K with oxygen atmospheres of 1 atm and 10–20 atm, respectively. Color coding: cyan, red, white, and small yellow spheres represent Pd, O, Ce4+, and Ce3+ atoms, respectively; the purple spheres in defective ceria represent O atoms adjacent to O vacancy sites. This notation is used throughout this paper.
