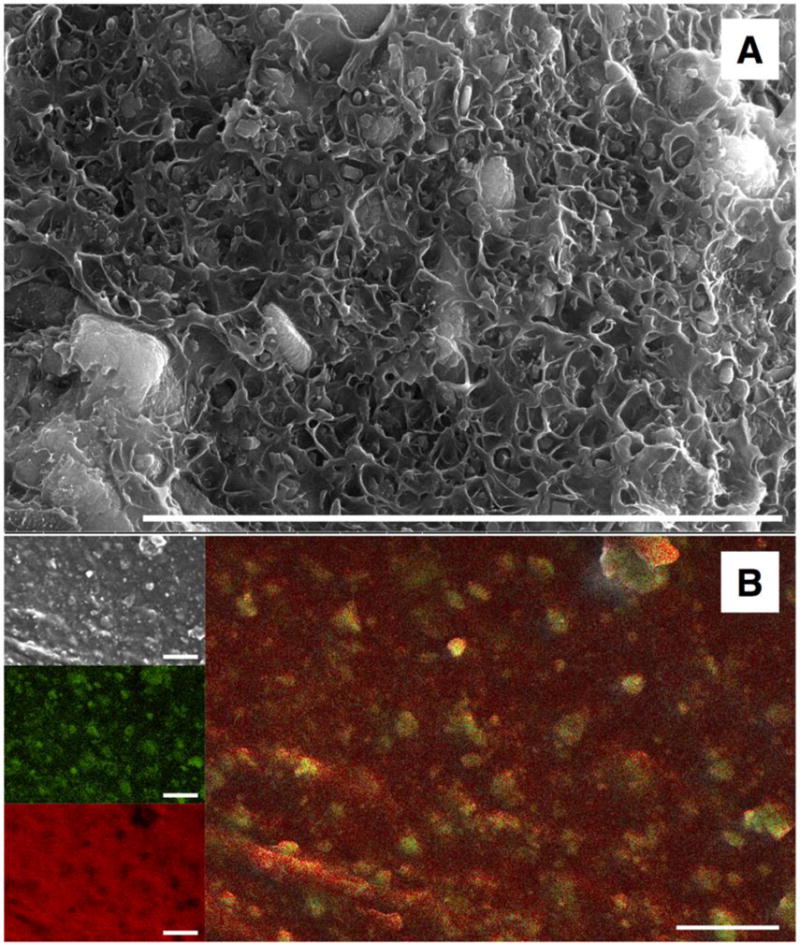
Figure 2. SEM and EDS analysis of a cross section of an object printed with ABS-10% MOF-5.

Scale bar: 10 μm. Panel A: SEM image showing the inorganic crystal within an amorphous polymer matrix. Panel B: (top left) SEM image, (middle left) EDS measured location of zinc atoms, (bottom left) EDS measured location of carbon atoms, (right) overlay of zinc and carbon location maps.
