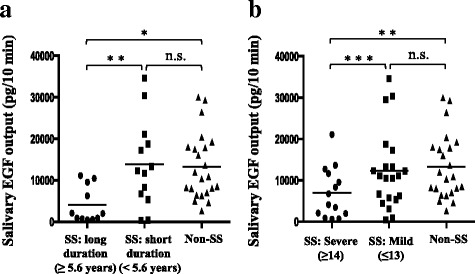
Fig. 1.

Salivary epidermal growth factor (EGF) levels of the Sjögren’s syndrome (SS) and non-SS groups. a The SS group was divided into the long-duration group and short-duration groups depending on disease duration, and salivary EGF output levels were compared between these groups and the non-SS group. b The SS group was divided into the severe and mild groups according to the severity of intraoral manifestations determined using the Oral Health Impact Profile (OHIP)-14 score, and salivary EGF output levels were compared between these groups and the non-SS group. Statistical differences were assessed using the Mann−Whitney U test. *p < 0.001, **p < 0.01, ***p < 0.05; n.s., not significant
