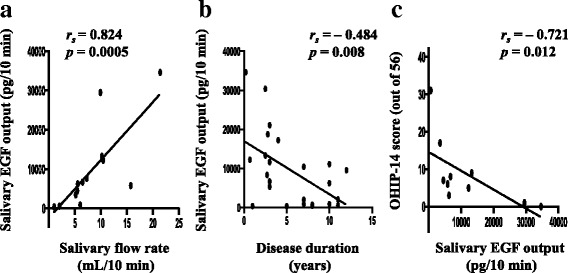
Fig. 2.

Correlations between different factors and salivary epidermal growth factor (EGF) output in the Sjögren’s syndrome (SS) group. a Correlation of salivary flow rate with salivary EGF output (n = 13). b Correlation of disease duration with salivary EGF output (n = 24). c Correlation of the Oral Health Impact Profile (OHIP)-14 score with salivary EGF output (n = 10). Correlations were assessed using Spearman’s rank correlation coefficient
