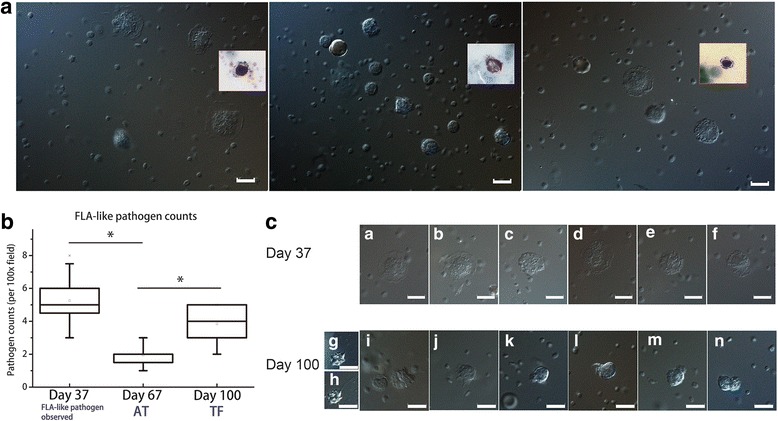
Fig. 3.

Microscopic findings in blood samples before and after treatment. a: Differential interference contrast images of the patient’s blood. The cells were discoid in shape, and the cytoplasmic humps were surrounded with flattened hyaline margins, some of which were fan-shaped. Insets are Giemsa-stained blood film images. b: Box chart showing FLA-like pathogen counts per high power magnification (100 ×) field in blood samples at three different time points. At each time point, 20 blood samples were sent for FLA pathogen counting. c: Light microscopic images of the patient’s blood before (a–f) and after treatment (g–n). After treatment, most forms are oval. g–n: Locomotive cells display short filopodia or conical non-branching pseudopodia arising from apical and/or lateral parts of the cell. g, h: Small cells showing refractive outline with single long (over 10 μm) filopodia. i, j: Large irregular cells with short (3–5 μm) filopodia. Scale bars: 10 μm
