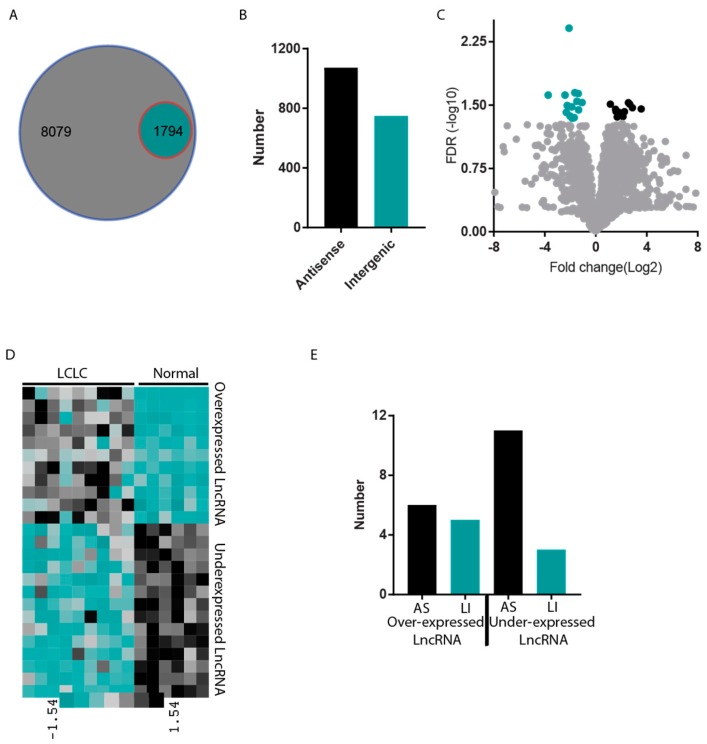
Figure 1.
Expression profile of long non-coding RNAs in large cell lung carcinoma (LCLC). (A) Venn diagram presenting total number of annotated LncRNA and expressed RNA. Big circle represents total number of LncRNA annotated and smaller circle represents the expressed LncRNA in LCLC. (B) Bar diagram showing number of intergenic and antisense LncRNA in expressed LncRNAs. (C) A volcano plot to show the significantly differentially expressed LncRNA in LCLC. Black dots show overexpressed genes and blue dots show underexpressed LncRNAs. (D) Heat map repressing the expression pattern of significantly differently regulated gene in LCLC. Color bar indicates the expression level with black high expression and Blue low expression. (E) Bar diagram to show the number of Antisense (AS) and Long intergenic differential expressed in LCLC.

