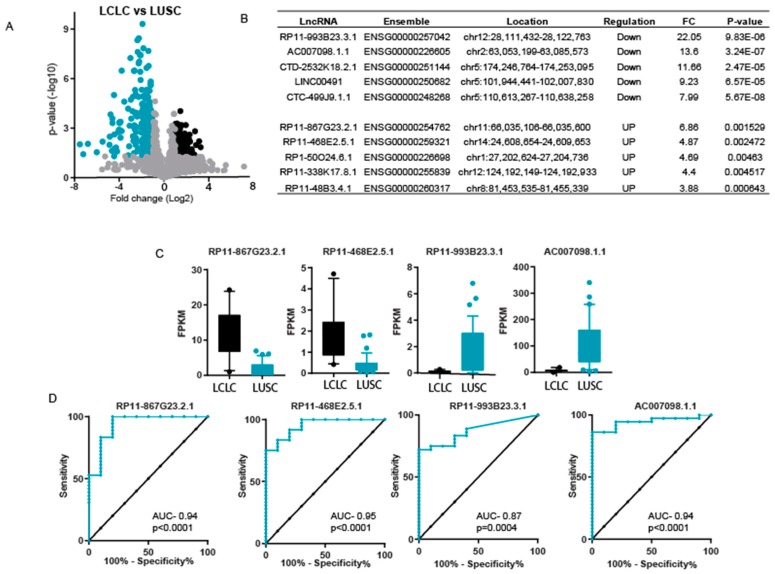
Figure 3.
Expression difference in LCLC and lung squamous carcinoma (LUSC). (A) A volcano plot to show the significantly differentially expressed LncRNA in LCLC as compared to LUSC. Black dots show overexpressed genes and blue dots show underexpressed LncRNAs. (B) List of top five underexpressed and top five overexpressed LncRNA in LCLC compared to LUSC. (C) The Box plot representing the expression level of indicated LncRNAs. The whiskers show the 10th and 90th percentile of expression. (D) Curve representing results of ROC analysis performed to show the sensitivity and specificity of mentioned LncRNA in LCLC vs. LUSC tumors.

