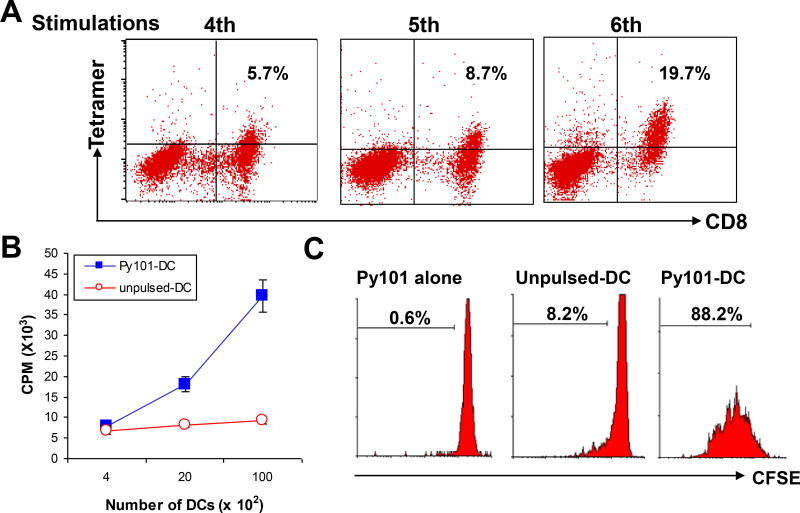
Figure 3.
Generation of cyclin D1 peptide-specific T-cell lines. (A) Frequency of cyclin D1 Py101 peptide-specific CD8+ T cells measured by HLA-A*0201 peptide-tetramer staining in cultures during in vitro stimulations. Proliferative responses measured by (B) 3[H]-thymidine incorporation or (C) CFSE dilution assays of T cells specific for Py101 peptide in response to autologous Py101 peptide-pulsed (Py101-DC) or unpulsed DCs. Figures inside dot plots or histograms represent the percentages of T cells. Shown are the results of a T-cell line generated from a HLA-A*0201+ blood donor. Similar results are obtained with other Py101 peptide-specific T-cell lines from HLA-A*0201+ blood donors or MCL patients.

