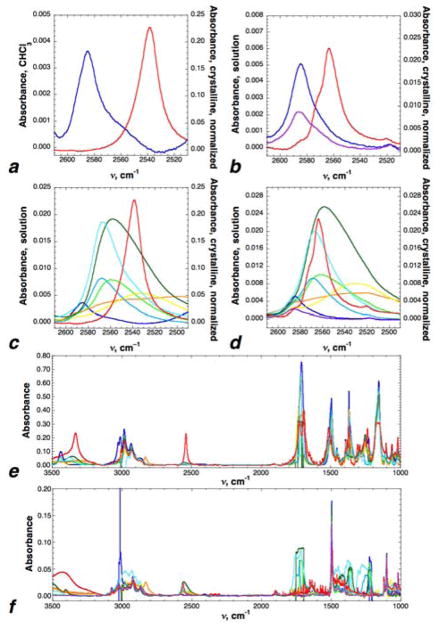
Figure 3.
(a–d) Infrared spectroscopy (S–H stretching region) of 1 and p-thiocresol. The left y-axis indicates absorbance for molecules (200 mM) in solution. The right y-axis indicates the absorbance for crystalline materials, with the crystalline absorbance normalized to the C–H stretching frequency intensity of the molecule in acetone at 2925–2935 cm−1. For (a–d), note the difference in scales of the left and right y-axes. (a) IR spectra of 1 in CHCl3 (1, blue, ν = 2585 cm−1) and in crystalline form (red, ν = 2538 cm−1). (b) IR spectra of p-thiocresol in CCl4 (violet, ν = 2586 cm−1), CHCl3 (blue, ν = 2585 cm−1), and crystalline form (red, ν = 2563 cm−1). (c, d) IR spectra of (c) 1 and (d) p-thiocresol in CCl4 (violet, p-thiocresol only), CHCl3 (blue), 25% ethyl acetate in CCl4 (light blue), ethyl acetate (cyan), 25% acetone in CCl4 (bright green), acetone (dark green), 25% THF in CCl4 (yellow), 25% MeOH in CCl4 (orange), and crystalline form (red). (e, f) Full IR spectra for (e) 1 and (f) p-thiocresol, with identical y-axes. Note the difference in intensity of the S–H stretching frequency in crystalline form versus solution states. Full IR spectra, non-normalized IR spectra, additional solvent data, and tabulation of νmax and intensities for 1 and p-thiocresol are in the Supporting Information.

