Figure 4.
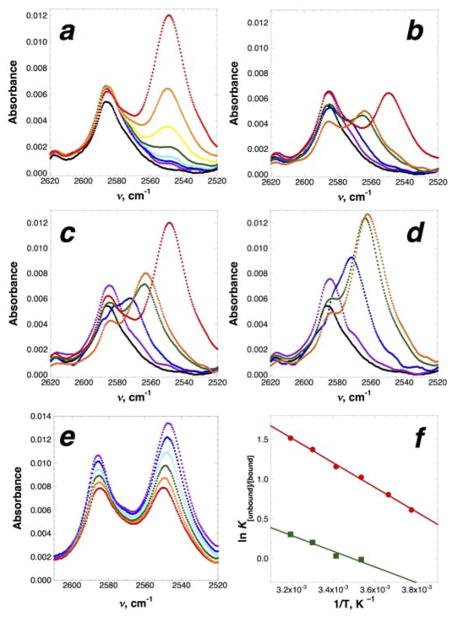
IR-based determination of the thermodynamic parameters of S–H/π interactions between p-thiocresol and added aromatic compounds. (a–d) Concentration-dependent IR spectra. Experiments were conducted at room temperature in CCl4 with 55 mM p-thiocresol and 0, 12.5, 25, 50, 100, 200, 400, 800, 1600, and 3200 mM aromatic compound. Experiments with hexamethylbenzene were not conducted at 1600 and 3200 mM due to insufficient solubility. Data represent the average of three independent trials; error bars were omitted for clarity. Data were fit to determine the Kd using a Lorentzian line-fitting algorithm at each concentration.41 (a) Concentration-dependent IR data indicating the interaction of 55 mM p-thiocresol with 0 (black), 12.5 (purple), 25 (blue), 50 (cyan), 100 (green), 200 (yellow), 400 (orange), and 800 (red) mM hexamethylbenzene. The non-interacting peak is at 2586 cm−1, while the interacting peak is at 2549 cm−1. The intensity of the peak at 2586 cm−1 includes contributions from the tail of the interacting peak; these effects are quantified in the Lorentzian fitting. (b–d) IR spectra (S–H stretching frequency) indicating S–H/π interactions between p-thiocresol and m-dichlorobenzene (violet; Kd = 13.5 ± 0.9 M), toluene (blue; Kd = 1.0 ± 0.23 M), mesitylene (green; Kd = 1.0 ± 0.13 M), 1-methylindole (orange; Kd = 0.69 ± 0.11 M), and hexamethylbenzene (red; Kd = 1.3 ± 0.2 M) at (b) 400 mM, (c) 800 mM, and (d) 1600 mM added aromatic. Data on p-thiocresol in the absence of an additional aromatic compound are indicated in black. p-Thiocresol also exhibits concentration-dependent formation of an additional self-association peak at 2572 cm−1 (Kself-association = 0.79 ± 0.12 M). Kd values indicated are based on the disappearance of the non-interacting p-thiocresol band; Kd values are higher when based on the appearance of the interacting band and fitting the saturating absorbance and the extinction coefficient of the interacting bands.41 In addition, the extinction coefficient for the interacting band depends on the added aromatic compound, with higher extinction coefficients for stronger S–H/π interactions (smaller νS–H).41 (e) Temperature-dependent change in the IR spectrum of 55 mM p-thiocresol in the presence of 400 mM hexamethylbenzene. Experiments were conducted at –8 ˚C (purple), 0 ˚C (blue), 10 ˚C (cyan), 20 ˚C (green), 30 ˚C (orange), and 40 ˚C (red). The intensities of both the non-interacting peak at 2586–2587 cm−1 and the interacting peak at 2549–2547 cm−1 increase with lower temperature. The non-interacting peak exhibits a 1 cm−1 blue shift, while the interacting peak exhibits a 2 cm−1 red shift, at lower temperature. (f) van’t Hoff plot for the interaction of hexamethylbenzene (red circles) and mesitylene (green squares) with p-thiocresol. Experiments were conducted with 55 mM p-thiocresol and 400 mM added aromatic.

