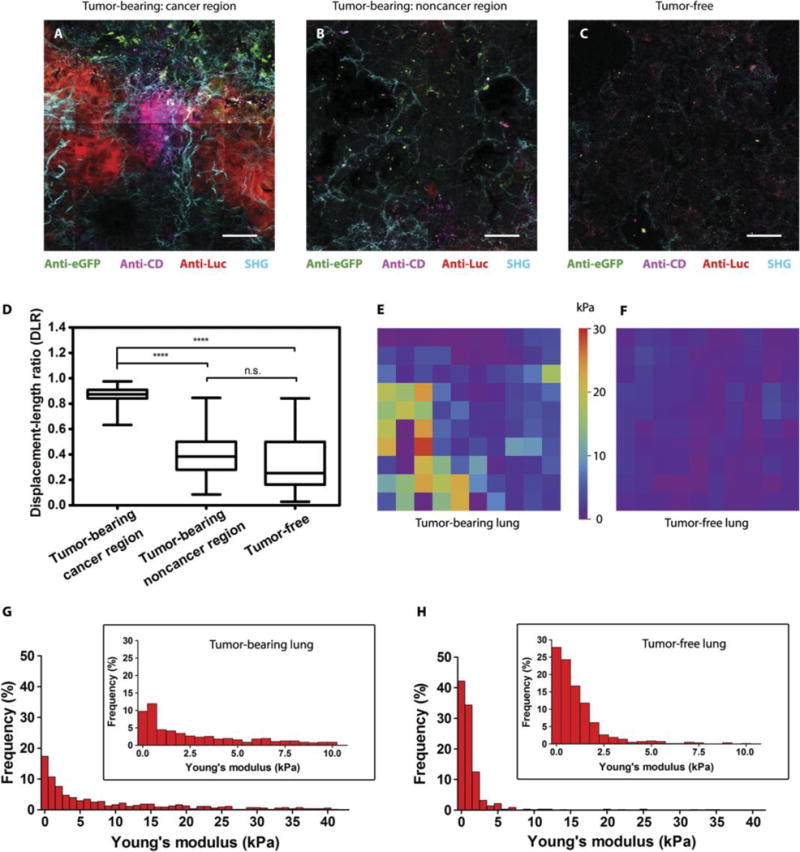
Fig. 5. Specific activation of MRCS in response to mechano-cues in the metastatic niche in vivo.

(A to C) Frozen sections of lungs of Luc-RFP-231 tumor-bearing NSG mice [cancer region in (A) and noncancer region in (B)] and tumor-free NSG mice (C) sacrificed 24 hours after infusion of MRCS-CD cotransfected with eGFP were stained with anti-Luc (red) to detect lung metastasis, anti-CD (magenta) for CD expressed by MRCS-CD, and anti-eGFP (green) for MRCS-CD tracking. SHG imaging of collagen networks (cyan) was also overlaid on IHC imaging. Scale bars, 50 μm. Multiple images were tiled into a larger composite image. Each representative image was then extracted from the tiled image. (D) Quantification of collagen linearization using displacement-to-length ratio (DLR) of collagen fibers in SHG images. For a line, DLR = 1, and for a curve, DLR < 1. Representative images are shown in fig. S20. Forty-five fibers per group were used for this analysis. Box and whisker plots are shown as minimum, 25th percentile, median, 75th percentile, and maximum. ****P <0.0001. (E and F) Representative AFM stiffness maps (50 μm × 50 μm) of tumor-bearing (E) and tumor-free (F) lungs. (G and H) Frequency of Young’s modulus values of tumor-bearing (G) and tumor-free (H) lungs from AFM microindentation in the range of 0 to 40 kPa (bin size = 1 kPa), whereas the inset graphs show the frequency within the range of 0 to 10 kPa (bin size = 0.5 kPa). Five hundred measurements per group were analyzed. P <0.001 (Young’s modulus of tumor-bearing lungs versus tumor-free lungs).
