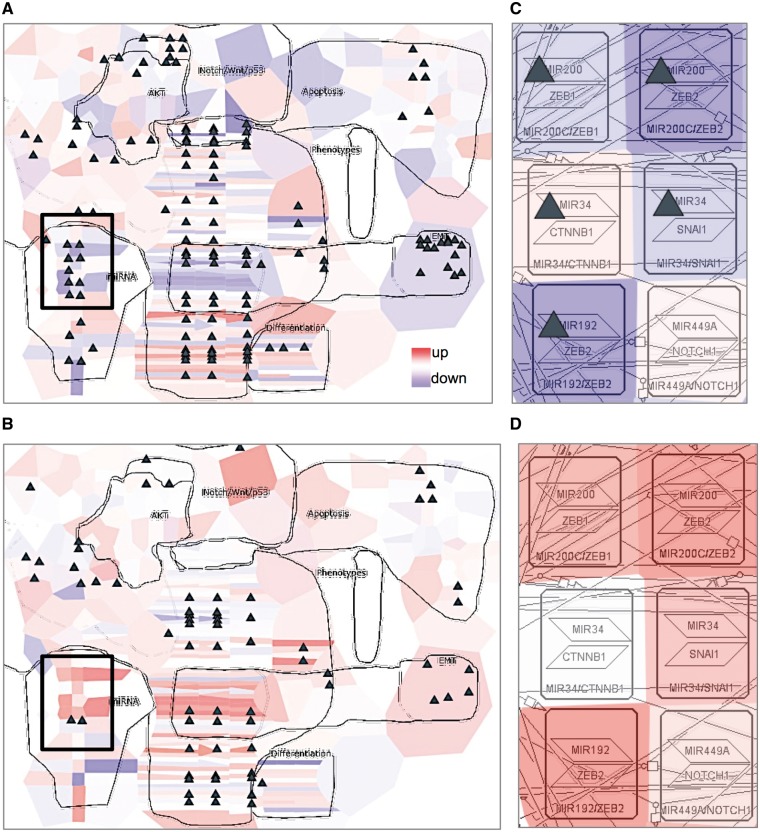
Figure 6.
Visualization of cancer high-throughput data in the context of DNA repair map. Visualization of gene expression from ovarian cancer samples in a form of map staining and mutation profile in a form of glyph (triangle). (A) Proliferative and (B) mesenchymal classes of ovarian cancer. Zoom in on EMT regulators in (C) proliferative and (D) mesenchymal classes of ovarian cancer. Proliferative group, n = 87, mesenchymal group, n = 96.

