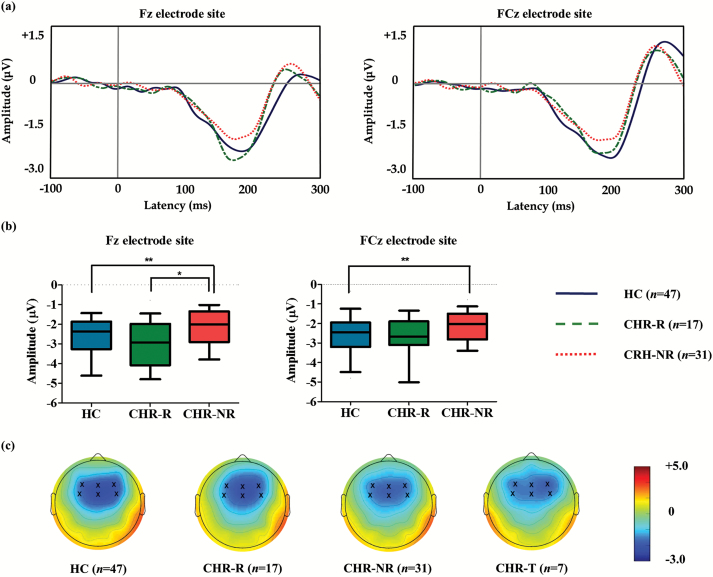
Fig. 1.
(a) Grand-averaged mismatch negativity (MMN) waveforms across the healthy controls (HC) and subjects at clinical high risk (CHR) for psychosis who remitted (CHR-R) or did not remit (CHR-NR). (b) The MMN amplitudes at the Fz and FCz electrode sites across the groups. The horizontal lines in the group indicate the means, and the vertical lines in the group indicate the10 to 90 percentile. * indicates that the mean difference is significant at the .05 level; ** indicates that the mean difference is significant at the .005 level. (c) Two-dimensional topographic maps of MMN in the HC, CHR-R, CHR-NR, and CHR-T subjects. The 6 frontocentral electrodes are indicated by an x in the topographic maps. The colored bar with numbers indicates the amplitude of MMN (μV).

