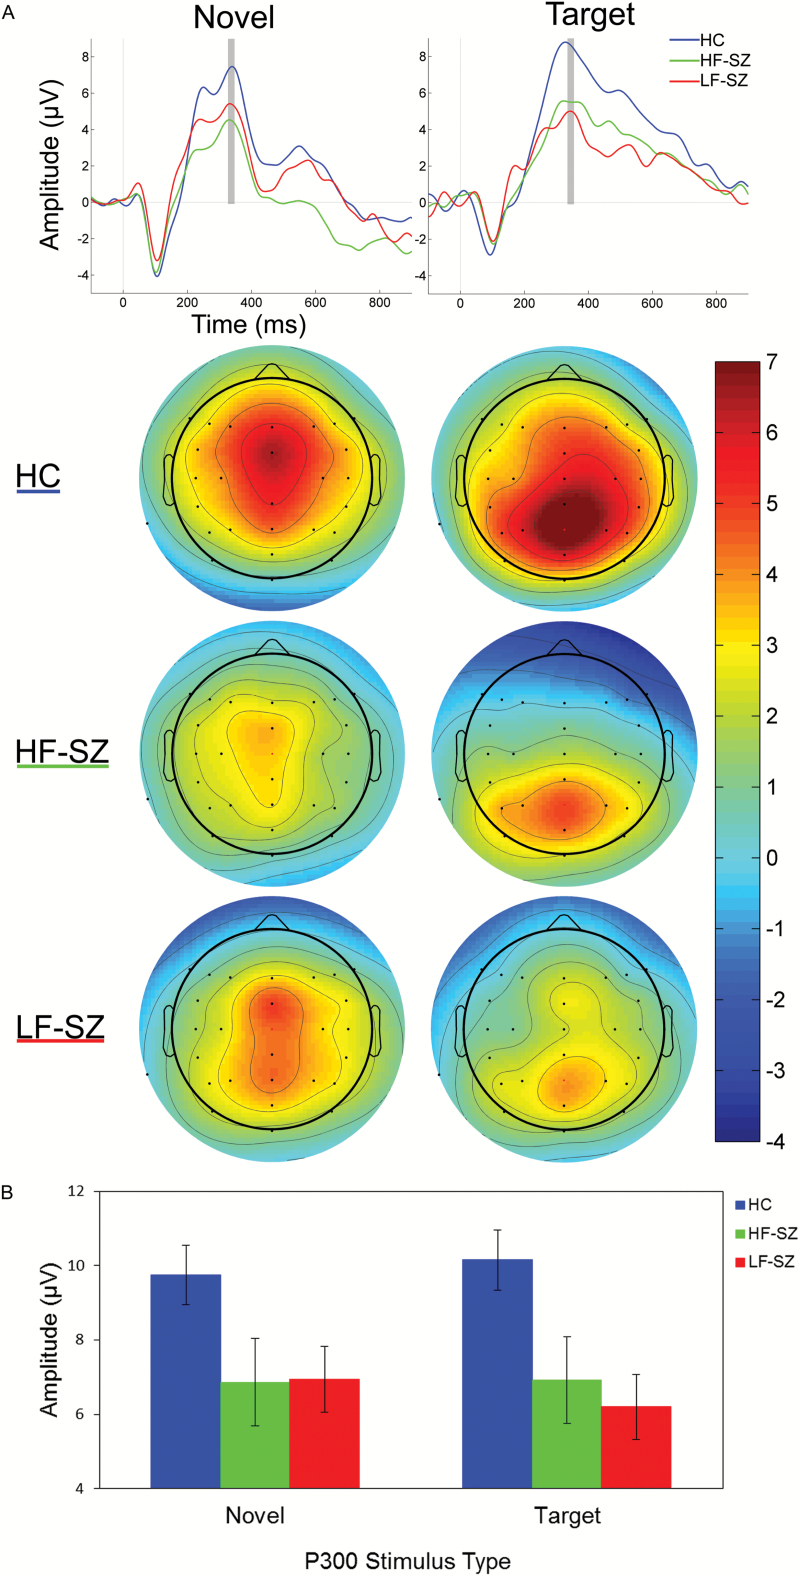
Fig. 2.
(A) P300 waveforms, averaged at Cz for novel stimuli (P3a) and Pz for target stimuli (P3b) for healthy comparison (HC), high-functioning schizophrenia (HF-SZ), and low-functioning schizophrenia (LF-SZ) participants. Scalp voltage topography maps, showing group means of P300 amplitudes around the peak latency ±10 ms (indicated by gray bars in waveform plots), are shown for novel and target stimuli. (B) Column graph shows means and standard errors for novelty P3a amplitudes at Cz and target P3b amplitudes at Pz.

