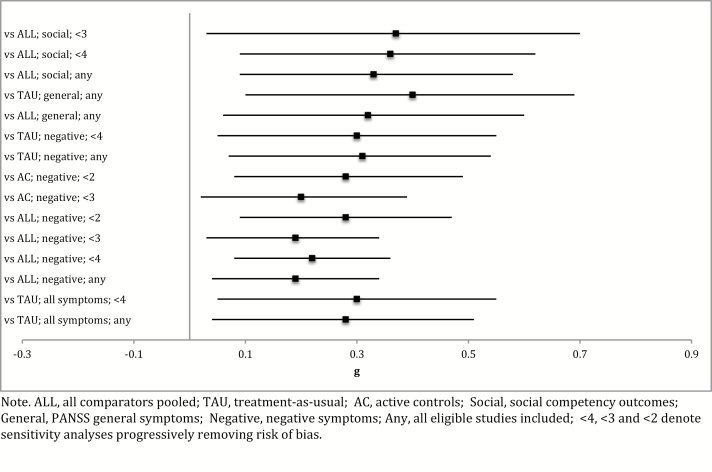
Fig. 2.
Summary forest plot of significant main results in Hedge’s g. ALL, all comparators pooled; TAU, treatment-as-usual; AC, active controls; Social, social competency outcomes; General, PANSS general symptoms; Negative, negative symptoms; Any, all eligible studies included; <4, <3, and <2 denote sensitivity analyses progressively removing risk of bias.

