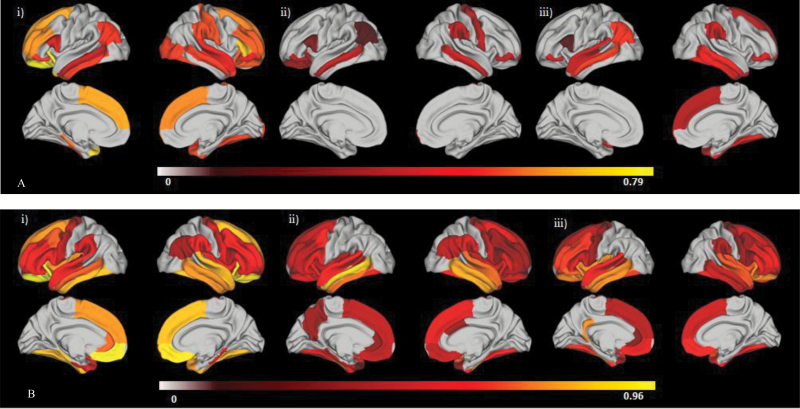
Fig. 2.
Patient–control effect size differences for regions surviving false discovery rate (FDR) correction. (A) Regional cortical volume; (B) regional cortical thickness. (i) Compromised cognitive subgroup (CIQ); (ii) deteriorated cognitive subgroup (DIQ); (iii) preserved cognitive subgroup (PIQ). Note that the left of each panel = left hemisphere, right = right hemisphere, top = lateral view, bottom = medial view. FDR correction at P < .05 was applied to between-groups comparisons for each modality for left and right hemispheres separately (34 comparison per hemisphere per modality). Post hoc pairwise comparisons of each region surviving the between-groups correction were also corrected. Regions that did not survive correction were assigned a value of 0. Color bar represents Cohen’s d values, with all subgroups showing reductions in volume or thickness compared to controls.

