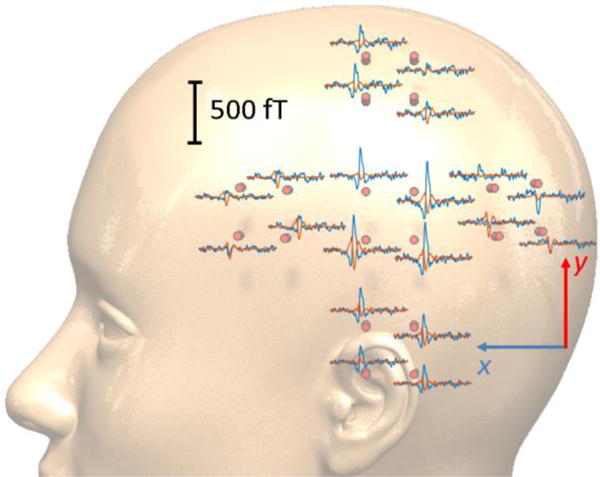
Figure 4.

The scalp level spatial topographies of the auditory evoked magnetic fields (AEF) measured using the presented 20-ch OPM array. Blue/red traces pertain to the x/y tangential components with 1 s of data shown. The middle sensor located above the ear shows the largest M100 component.
