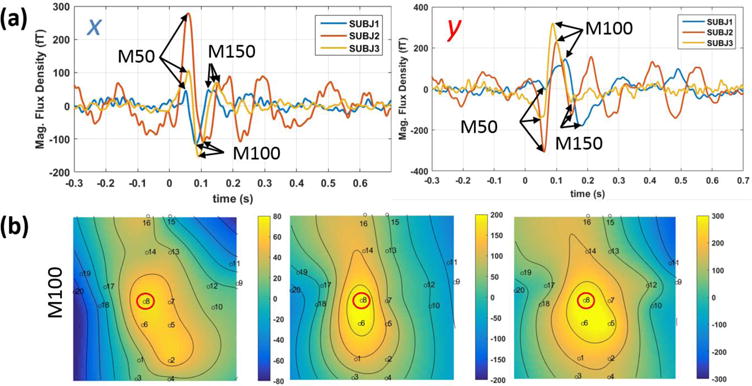
Figure 5.

a) the time-domain auditory evoked magnetic fields time-locked to the standard tone for the y (left) and x (right) tangential components, b) fieldmap plots of the x-component of the magnetic field of the three subjects at the peak of M100. The channel plotted in (a) is circled in red on the fieldmap plots.
