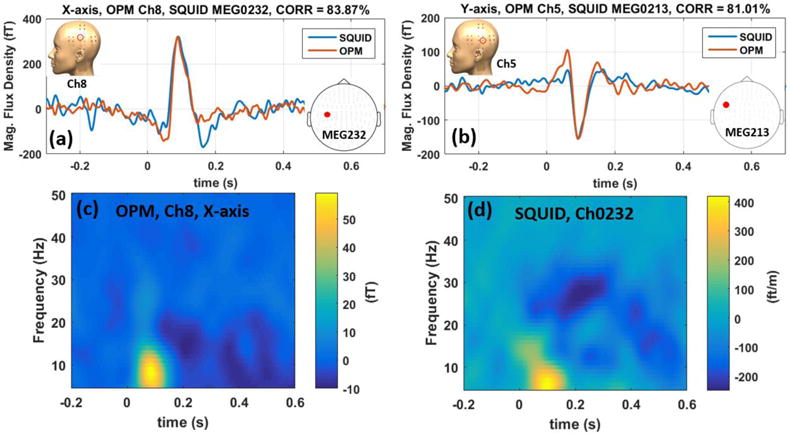
Figure 6.

Comparing OPM vs. SQUID AEF data in time domain for x-axis (a) and y-axis (b). The SQUID data are scaled to match the amplitude of the OPM data. Time-frequency spectra of the OPM and SQUID AEF data are compared in (c) and (d) for the x-axis modulation. These figures show excellent agreement between the SQUID and OPM array in both time and frequency domains.
