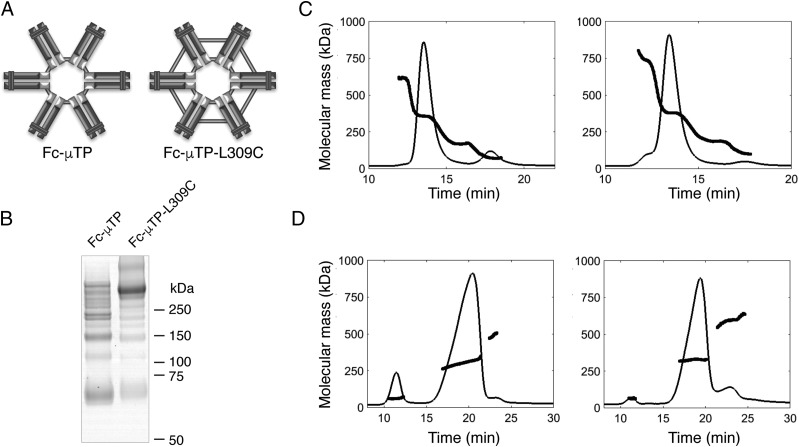
FIGURE 1.
Biochemical characterization of rFc multimers. (A) Schematic diagram of Fc-μTP and Fc-μTP-L309C hexamer structures. Light gray bars represent presumed disulphide bonds. (B) SDS-PAGE of Fc-μTP (left) and Fc-μTP-L309C (right) rFc multimers. Molecular mass markers in kDa are shown. (C) SEC and (D) A4F with MALS of Fc-μTP (left panels) and Fc-μTP-L309C (right panels). Chromatograms show the normalized UV (280 nm) signals, and the bold lines are the molecular mass (in kDa) of material eluted at the time indicated.

