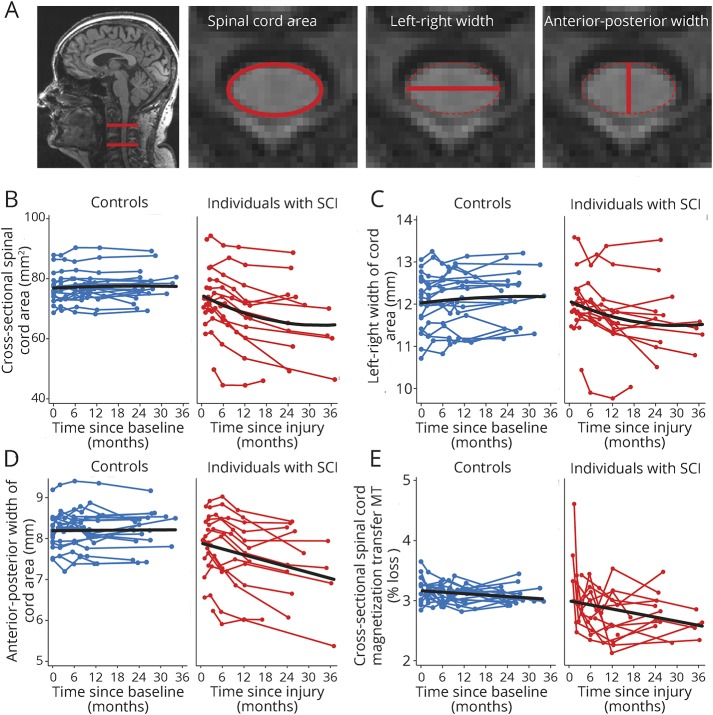
Figure 1. Longitudinal changes in spinal cord MRI indices.
(A) Illustration of measures of cross-sectional spinal cord area, left-right width, and anterior-posterior width at cervical level C2-C3. (B) Change in cross-sectional spinal cord area at the C2-C3 level and (C) left-right width and (D) anterior-posterior width after injury in patients with spinal cord injury and in controls over 2 years. (E) Change in mean MT (in % loss of magnetization) at the C2-C3 level after injury in patients with spinal cord injury and in controls over 2 years. Note that black, solid lines depict the fitted model; blue and red points and lines show observed individual longitudinal data for controls and patients, respectively. MT = magnetization transfer saturation; SCI = spinal cord injury.

