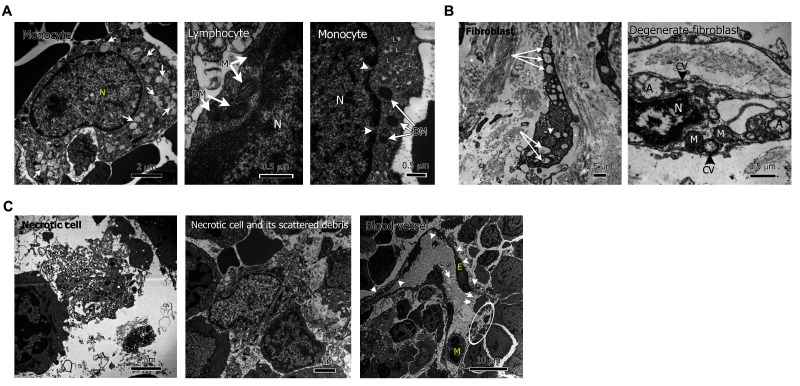
Figure 4.
Ultrastructural findings of extensive cellular degeneration and necrosis. (A) Mitochondrial degeneration, from left to right: monocyte in patient 4 bone marrow (BM) with numerous degenerated mitochondria (white arrows); lymphocyte in patient 4 BM with coexistence of two normal mitochondria (M) and two abnormal, degenerate mitochondria (DM); monocyte in patient 6 BM with accumulation of lipid droplets (L), degenerate mitochondria (DM) (white arrows), nuclear envelope gaps (white arrowheads, N=nucleus). (B) Increased autophagosomes, from left to right: skin fibroblast in patient 6 with multiple autophagosomes (white arrows), degenerated mitochondrion (white arrowhead); degenerate fibroblast in patient 6 with pyknotic nucleus (N), extranuclear chromatin vesicles (CV), autophagosomes (A) and degenerate mitochondria (M). (C) Necrotic cells and debris in patient 4 BM (left and middle panel); blood vessel in P4 BM showing abnormal, degenerate endothelial cell (E), with thin, rough margins (white arrowheads), autophagosomes within serum (white arrows), vessel wall breakage and serum leakage (white circle) (M=monocyte).

