Figure 6.
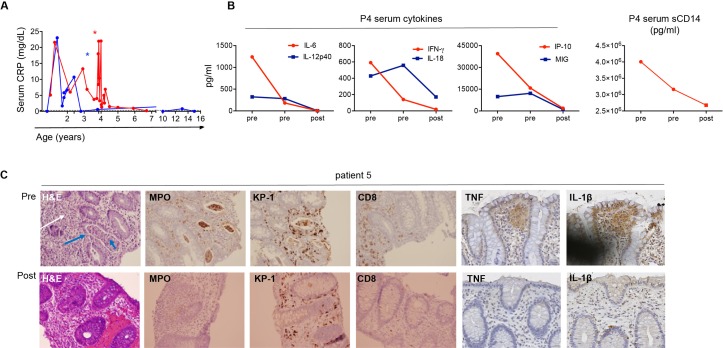
Treatment with TNF inhibitors normalised the inflammatory signature in SIFD. (A) Serum CRP levels before and after treatment in patients 4 and 5. Asterisks indicate the initiation of therapy with etanercept for patient 4 (shown in red) and infliximab for patient 5 (shown in blue). (B) Normalisation of serum proinflammatory cytokines and soluble sCD14 levels, a marker of monocyte activation, in patient 4 following initiation of etanercept. (C) Patient 5 colon biopsy showing resolution of inflammation with anti-TNF therapy. Top row showing abnormal findings pretreatment: from left to right: H&E staining with cryptitis (blue long arrow), crypt abscesses (blue short arrow) and lymphoplasmatic infiltrates (white arrow); inflammatory infiltrates by neutrophils (MPO+); macrophages (KP1+) and CD8+ T cells in tissue immunohistochemistry; positive TNF and IL-1β immunohistochemistry staining. Bottom row: resolution of pretreatment abnormal findings following initiation of infliximab. (MPO: myeloperoxidase, KP1: macrosialin). CRP, C reactive protein; IL, interleukin; SIFD, sideroblastic anaemia with immunodeficiency, fevers and developmental delay; TNF, tumour necrosis factor.

