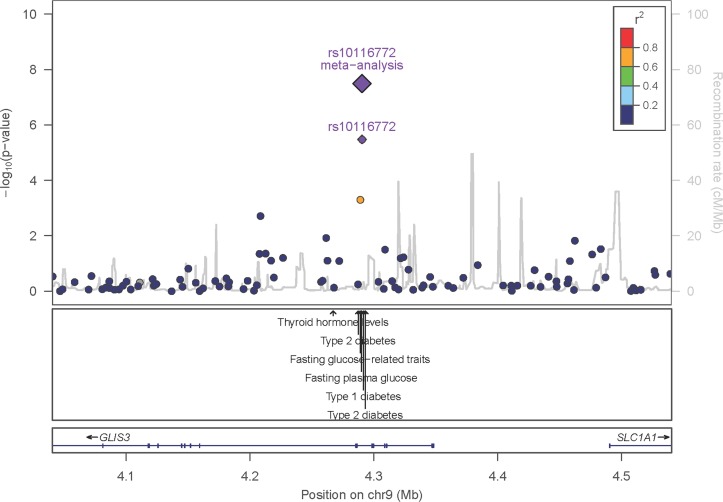
Figure 1.
Association of variants at GLIS3 with osteoarthritis. The x-axis shows the genomic interval, the left y-axis shows the statistical significance of association as negative log10 of P values. rs10116772 was used as the reference SNP and its P value in the discovery set, and postreplication is denoted by the purple circle and diamond, respectively. The linkage disequilibrium is presented as pairwise r2 between the reference SNP and the other SNPs in the region with colours according to different bins (0–0.2: dark blue; 0.2–0.4: light blue; 0.4–0.6: green; 0.6–0.8: orange; 0.8–1.0: red). The location of variants associated with other traits as reported in the NHGRI-EBI GWAS catalogue (P<10−5) is shown by the arrows. SNP, single nucleotide polymorphism.

