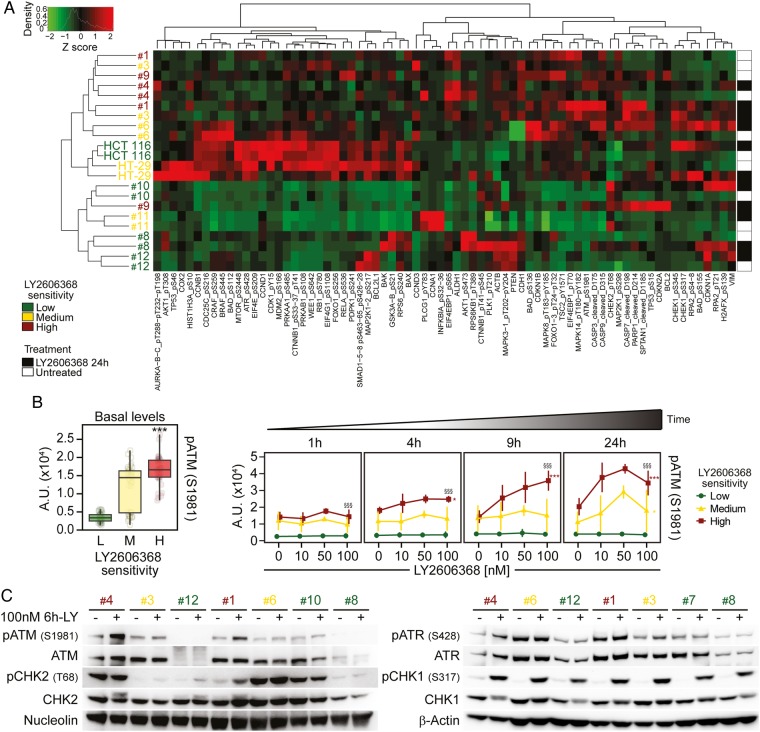
Figure 3.
Phosphorylation of ataxia telangiectasia mutated serine/threonine kinase (ATM) as a marker of colorectal cancer stem cells (CRC-SCs) sensitivity to LY26063668. (A and B) Nine representative CRC-SCs, three from each group of LY2606368 sensitivity, and the ATCC cell lines HCT 116 and HT-29 were left untreated or treated with LY2606368 at low doses (10 nM, 50 nM and 100 nM) for 1 hour, 4 hours, 9 hours or 24 hours and then subjected to reverse-phase protein microarray (RPPA) analysis. Panel (A) represents the hierarchical clustering of RPPA results obtained on untreated CRC-SCs (white) and CRC-SCs exposed for 24 hours to 100 nM LY2606368 (black). In the left part of (B), basal levels of phosphorylated (p)ATM (pATM_S1981) in untreated CRC-SCs at all time points were pooled for each sensitivity group and box-plotted. Statistical analysis: Wilcoxon signed-rank test followed by p value adjustment by false discovery rate (FDR) for the comparison of high versus low sensitive CRC-SCs (*p<0.05, **p<0.01, ***p<0.001). In (B), on the right, the full time-dependent and dose-dependent RPPA kinetics of pATM are shown as means±SD of CRC-SCs grouped by LY2606368 sensitivity. Statistical analysis: factorial ANOVA design followed by p value adjustment (Tuckey's honestly significant difference (HSD)) for the comparison of (1) 100 nM LY2606368-treated versus untreated CRC-SCs of the same sensitivity group (*p<0.05, **p<0.01, ***p<0.001) or (2) high versus low sensitive CRC-SC treated with 100 nM LY2606368 (§p<0.05, §§p<0.01, §§§p<0.001). A.U., arbitrary units. (C) The illustrated CRC-SCs were left untreated (–) or administrated with 100 nM LY2606368 (LY) for 6 hours (+) and then subjected to western blot analyses with antibodies recognising the phosphorylated or total forms of ATM, checkpoint kinase (CHK)2, ataxia telangiectasia mutated and Rad3 related serine/threonine kinase (ATR) or CHK1. Nucleolin or β-actin levels were monitored to ensure equal loading of lanes. Note that six CRC-SCs, two from each sensitivity class, were the same used in RPPA studies. One representative western blot is shown. For the densitometric and statistical analysis of the western blots, refer to online supplementary figure S5 and online supplementary information. LY2606368-high (H), LY2606368-medium (M) and LY2606368-low (L) sensitive CRC-SCs are depicted in red, yellow and green, respectively.

